empty
03.11.2023 06:46 AM
EUR/USD and GBP/USD: Technical analysis for November 3

EUR/USD

This image is no longer relevant

Higher Timeframes

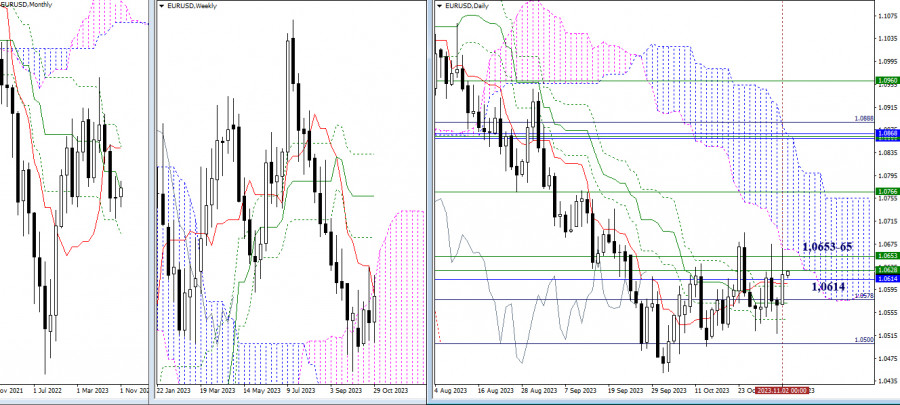
Bulls continue to make efforts and strive to achieve results. The obstacles in their path are currently concentrated in the resistance zone of 1.0614 - 1.0628 - 1.0653 - 1.0665 (monthly medium-term trend + weekly levels + the lower boundary of the daily cloud). Breaking through these boundaries is the first step towards new prospects and opportunities. The next upward target in the current situation can be marked at the level of 1.0766 (weekly Fibonacci Kijun). Meanwhile, for bears, it remains important to overcome the supports at 1.0500 - 1.0449 and restore the downward trend.

This image is no longer relevant

H4 - H1

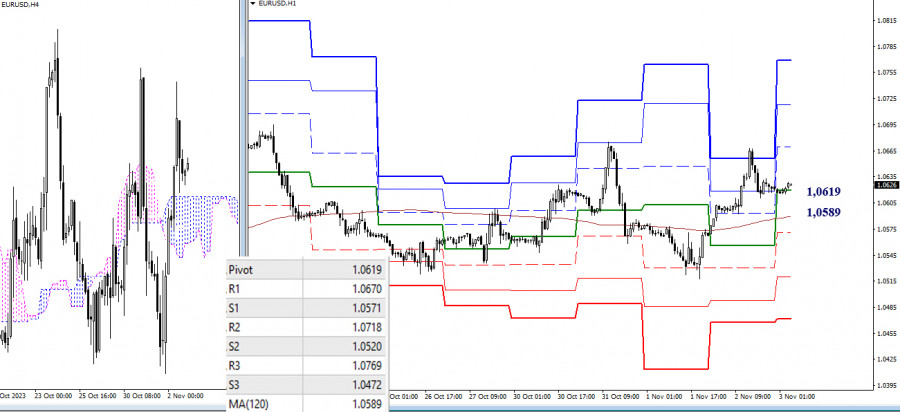
On the lower timeframes, despite the current decline, bulls continue to maintain an advantage. The resistances of the classic pivot points have expanded the potential for an upward move today, setting their targets at 1.0670 - 1.0718 - 1.0769. The loss of key levels at 1.0619 - 1.0589 (central pivot point + weekly long-term trend) may change the current balance of power in favor of strengthening bearish sentiments. In this case, attention will shift to the supports of the classic pivot points (1.0571 - 1.0520 - 1.0472).

***

GBP/USD

This image is no longer relevant

Higher timeframes

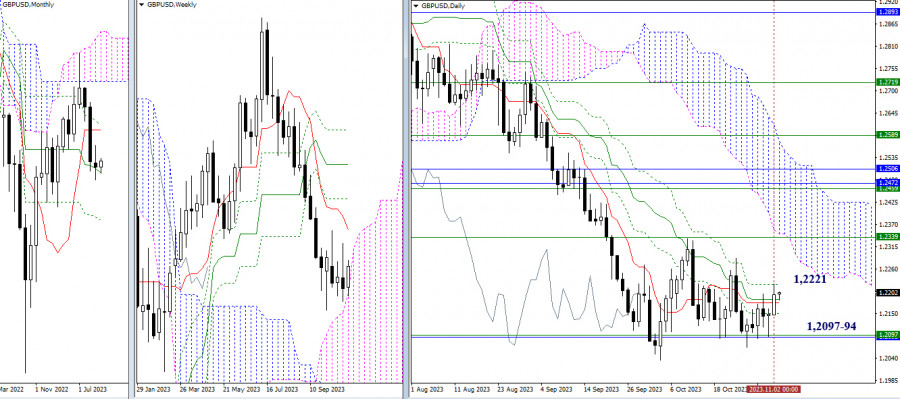
Yesterday, bulls continued to work with the resistances of the death cross of the daily Ichimoku cloud, the final level of which is 1.2221. The elimination of the daily cross will allow for consideration of new targets, such as the resistances of the weekly short-term trend (1.2339) and the lower boundary of the daily cloud (1.2347). The failure of the bulls and a return to the opponent's market will bring the relevance of passing the supports that continue to limit the current consolidation, located at 1.2094 - 1.2097 (upper boundary of the weekly cloud + monthly medium-term trend) and 1.2036 (low).

This image is no longer relevant

H4 - H1

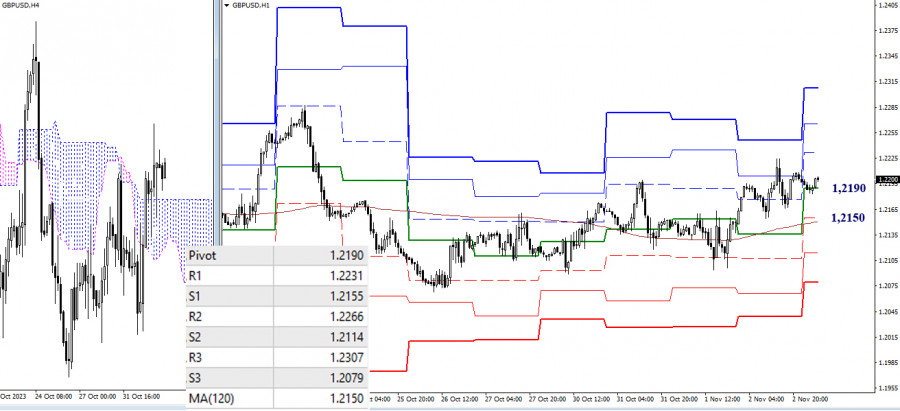
The main advantage, at the moment, continues to be on the bulls' side, as the pair on lower timeframes is still above the weekly long-term trend, which is currently located at the level of 1.2150. The reference points for the development of intraday movement are the classic pivot points. So, for bulls, the resistances of the classic pivot points (1.2231 - 1.2266 - 1.2307) may be of interest today, and for bears, the supports of the classic pivot points (1.2114 - 1.2079) may be significant.

***

The technical analysis of the situation uses:

Higher timeframes - Ichimoku Kinko Hyo (9.26.52) + Fibo Kijun levels

Lower timeframes - H1 - Pivot Points (classic) + Moving Average 120 (weekly long-term trend)

Evangelos Poulakis,
Especialista em análise na InstaForex
© 2007-2025
Selecionar intervalo de tempo
5
min
15
min
30
min
1
hora
4
horas
1
dia
1
s.
Ganhe com as variações das taxas das criptomoedas com a InstaForex.
Baixe o MetaTrader 4 e abra a sua primeira operação.
  • Grand Choice
    Contest by
    InstaForex
    InstaForex always strives to help you
    fulfill your biggest dreams.
    PARTICIPE DO CONCURSO

Recommended Stories

Análise técnica do movimento intradiário de preços do EUR/GBP, segunda-feira, 21 de abril de 2025

Com base no gráfico de 4 horas, o par EUR/GBP parece estar se movendo acima da EMA (100), o que indica que os compradores dominam o par. Assim, no futuro

Arief Makmur 15:36 2025-04-21 UTC+2

Análise técnica do movimento intradiário do USD/JPY, segunda-feira, 21 de abril de 2025.

Com o surgimento da convergência entre o movimento de preço do principal par de moedas USD/JPY, o indicador Oscilador Estocástico e a posição da EMA (100), que está acima

Arief Makmur 15:31 2025-04-21 UTC+2

Análise técnica do movimento intradiário de preços do índice Nasdaq 100, quinta-feira, 17 de abril de 2025

Com base na análise do gráfico de 4 horas do índice Nasdaq 100, destacam-se três pontos principais: primeiro, o movimento dos preços ocorre abaixo da média móvel de 100 períodos

Arief Makmur 15:16 2025-04-17 UTC+2

Previsão para o EUR/USD para 17 de abril de 2025

Na quarta-feira, o euro novamente entrou na faixa-alvo de 1,1385-1,1420. No entanto, o comportamento recente dos preços sugere que o nível de 1,1385 agora se tornou irrelevante – estamos observando

Laurie Bailey 14:58 2025-04-17 UTC+2

Previsão para o GBP/USD para 17 de abril de 2025

Ontem, o Reino Unido divulgou os dados de inflação de março. O IPC básico caiu de 3,0% ao ano para 2,8% ao ano, enquanto o IPC geral diminuiu de 2,8%

Laurie Bailey 14:54 2025-04-17 UTC+2

Previsão para o USD/CAD para 17 de abril de 2025

No gráfico diário, o oscilador Marlin aponta para uma possível reversão de alta. Abaixo, permanecem como referências o nível-alvo de 1,3746 e o limite inferior do canal de preços

Laurie Bailey 14:50 2025-04-17 UTC+2

Ouro: A incerteza contínua continua a sustentar os preços do ouro

Os preços do ouro continuam sustentados pela névoa de incertezas que cerca o desdobramento das guerras tarifárias iniciadas por Donald Trump. O metal precioso vem apresentando uma valorização quase vertical

Pati Gani 14:30 2025-04-17 UTC+2

Sinais de negociação para o OURO (XAU/USD) para 16-18 de abril de 2025: venda abaixo de $3.320 (sobrecompra - SMA 21)

O indicador Eagle está atingindo uma sobrecompra extrema. Portanto, nos níveis de preço atuais, abaixo de sua maior alta de todos os tempos, será possível vender visando chegar a 3.281

Dimitrios Zappas 20:58 2025-04-16 UTC+2

Análise técnica do movimento intradiário de preços do USD/CAD, quarta-feira, 16 de abril de 2025

No gráfico de 4 horas, o par de moedas USD/CAD (moeda de commodities) apresenta movimentação abaixo da média móvel exponencial de 100 períodos (EMA 100), com a formação

Arief Makmur 16:10 2025-04-16 UTC+2

Análise técnica do movimento intradiário de preços do AUD/JPY, quarta-feira, 16 de abril de 2025

Com o Oscilador Estocástico se aproximando da zona de sobrevenda (nível 20) no gráfico de 4 horas do par cruzado AUD/JPY, existe potencial de enfraquecimento de curto prazo

Arief Makmur 16:00 2025-04-16 UTC+2
Não pode falar agora?
Faça sua pergunta no chat.
Widget callback
 

Dear visitor,

Your IP address shows that you are currently located in the USA. If you are a resident of the United States, you are prohibited from using the services of InstaFintech Group including online trading, online transfers, deposit/withdrawal of funds, etc.

If you think you are seeing this message by mistake and your location is not the US, kindly proceed to the website. Otherwise, you must leave the website in order to comply with government restrictions.

Why does your IP address show your location as the USA?

  • - you are using a VPN provided by a hosting company based in the United States;
  • - your IP does not have proper WHOIS records;
  • - an error occurred in the WHOIS geolocation database.

Please confirm whether you are a US resident or not by clicking the relevant button below. If you choose the wrong option, being a US resident, you will not be able to open an account with InstaForex anyway.

We are sorry for any inconvenience caused by this message.