Conditions for opening long positions on EUR/USD:
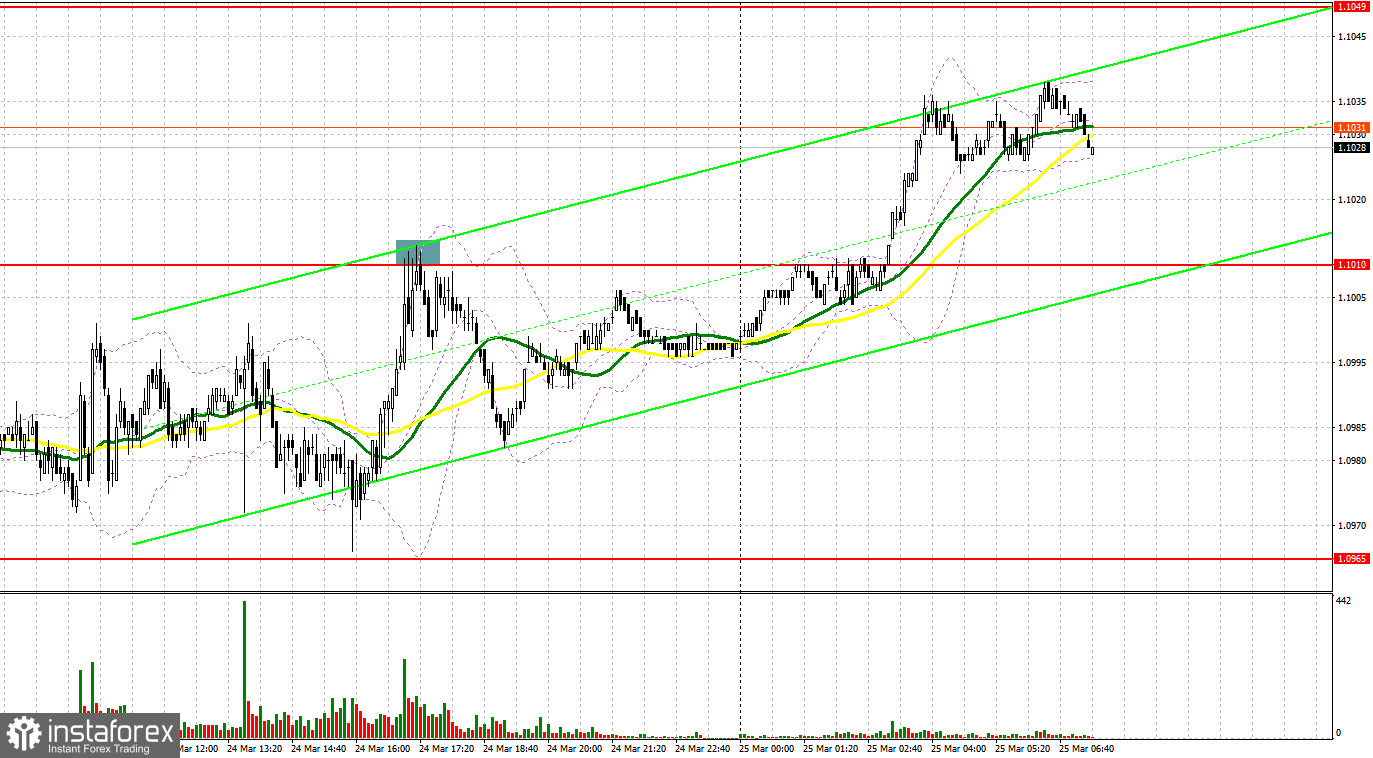
Yesterday, traders received only one signal to enter the market in the second part of the day. Let us take a look at the five-minute chart to analyze the current market situation. Earlier, I asked you to focus on several levels to decide when to enter the market. However, the pair failed to hit the expected levels due to very low volatility. That is why traders did not receive any signals to enter the market. In the second part of the day, the situation changed a bit and the price touched the resistance level of 1.1010. A false break of this level gave a perfect signal to open sell orders. As a result, the pair lost 35 pips.
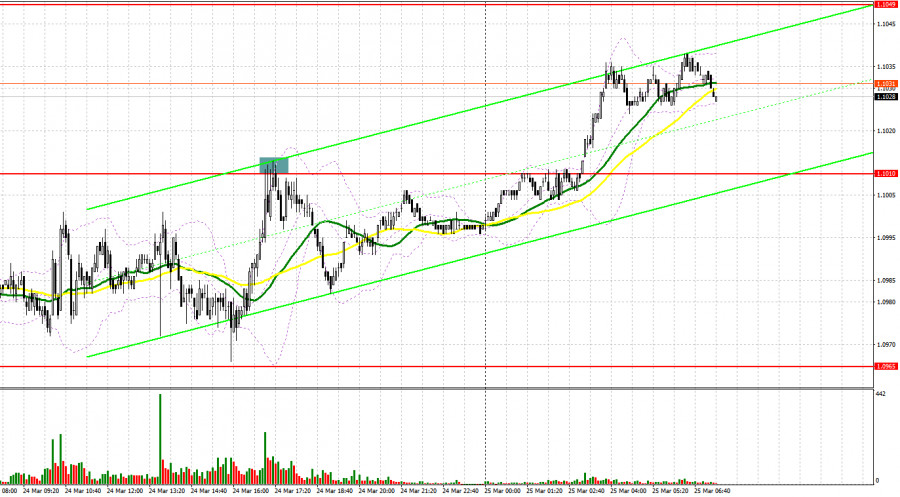
At present, market participants are not so concerned about the Fed's announcements about monetary policy. That is why buyers of the euro managed to push the price above the middle level of the sideways channel located at 1.1006. Now, bulls will do their best to close the week on a positive note. First of all, they should protect the support level of 1.1006. It is a key level where a lower limit of the upward channel could be formed. The euro/dollar pair may decline to 1.1006 after the publication of weak reports on Germany's business climate indicator, the current assessment index, and the expectations index. This may lead to a false break. To rise, the pair should break the upper limit of the range of 1.1050. Since the geopolitical situation remains unchanged, demand for risk assets will hardly increase. However, Joe Biden's announcement that only Ukraine has the right to decide on concessions boosted demand for risk assets. Investors concluded that the negotiations might soon bring results since NATO refused to help Ukraine. Only a downward test of 1.1050 may provide a buy signal and allow the pair to recover to 1.1091. A farther target is located at the monthly high of 1.1136, where it is recommended to lock in profits. A break of this level may limit the bearish trend and affect sellers' stop orders, allowing the price to climb to the highs of 1.1181 and 1.1227. However, this scenario will become possible only at the end of the week. If the pair falls and bulls fail to protect 1.1006, it will be better to avoid long positions. Traders may open buy positions after a false break of the low of 1.0968. It is also possible to go long from 1.0928, expecting a rise of 30-35 pips within the day.
Conditions for opening sell positions on EUR/USD:
Yesterday, bears did their best to protect the middle level of the sideways channel, but all in vain. Since expectations of a more aggressive approach from the Federal Reserve are of minor importance now, traders have shifted their attention to the geopolitical situation. Now, sellers of the euro are quite calm but they should protect the resistance level of 1.1050.This level is acting as the upper limit of the sideways channel. A false break of 1.1050 may give a sell signal with the target at the support level of 1.1006. Since Germany's macroeconomic data is likely to be worse than expected, the pair has a chance to break 1.1006 and settle below it. An upward test of this level may provide an additional signal to open short positions with the target at the lower limit of the sideways channel at 1.0968. A break of this level may allow the pair to slide to 1.0928 and 1.0891. It is recommended to lock in profits at 1.0855. If the euro/dollar pair advances and bears fail to protect 1.1050, bulls will continue opening long positions, hoping for a jump to monthly highs. In this case, it will be wise not to open sell orders. Traders may open short orders after a false break of 1.1091. It is also possible to sell the euro/dollar pair from 1.1136 or from 1.1181, expecting a decline of 20-25 pips.
Commitment of Traders Report
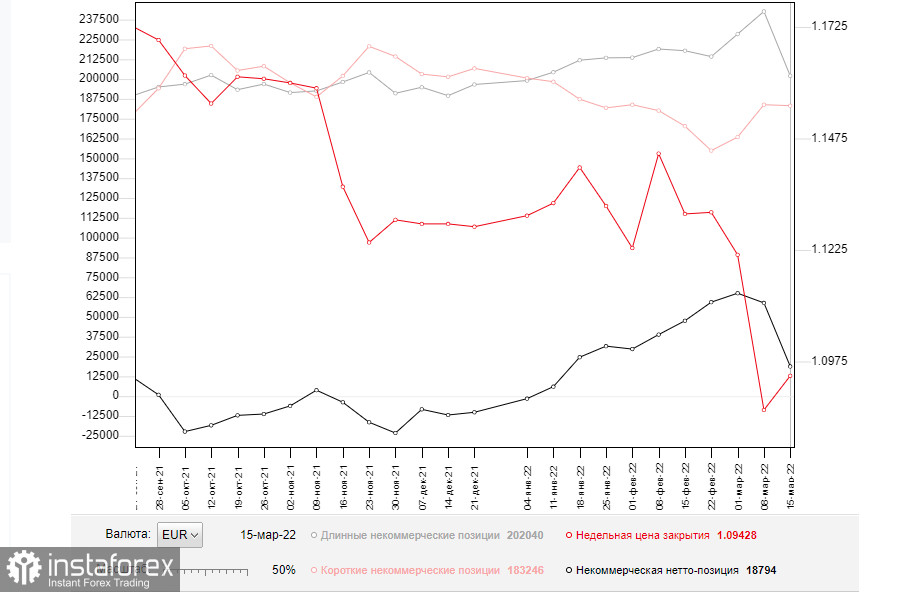
According to the COT report from March 15, the number of long and short positions dropped. However, a decline in the number of short positions was insignificant, whereas the number of long positions slumped. Such a considerable decrease was mainly caused by the special military operation in Ukraine. The Fed's meeting was the main event of the previous week. The regulator raised the benchmark rate by 0.25%. However, the decision did not affect the market since traders had priced in such a result long ago. Notably, Fed Chair Jerome Powell took the wait-and-see approach during the press conference. He did not announce a more aggressive approach, thus boosting the number of long positions on risk assets. However, early this week, the Fed Chair changed his approach, emphasizing that the key interest rate could be raised by 0.5% at the following meeting. It is a strong bullish signal for the US dollar, which is highly likely to go on climbing against the euro.
Not so long ago, the ECB also held a meeting, where Christine Lagarde announced the central bank's plans for a faster QE tapering and key interest rate hike. It is good for the euro's mid-term future since the currency is significantly oversold against the greenback. According to the COT report, the number of long non-commercial positions declined to 202,040 from 242,683. Meanwhile, the number of short non-commercial positions dropped to 183,246 from 183,839. The weekly close price inched up to 1.0942 from 1.0866.
Signals of indicators:
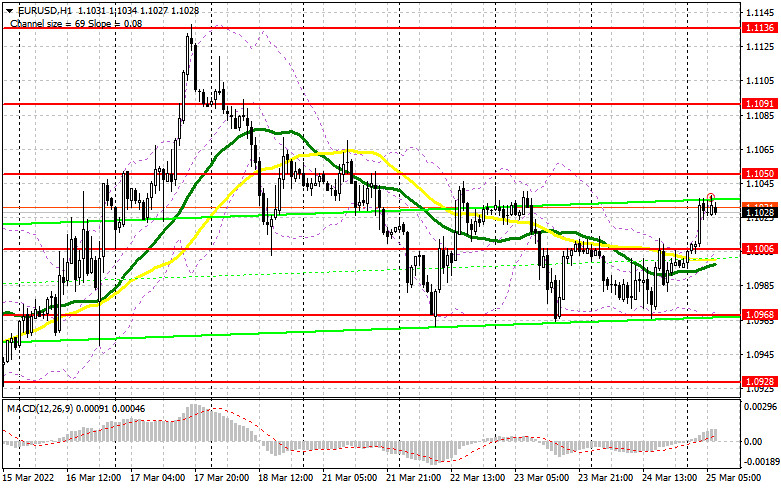
Moving Averages
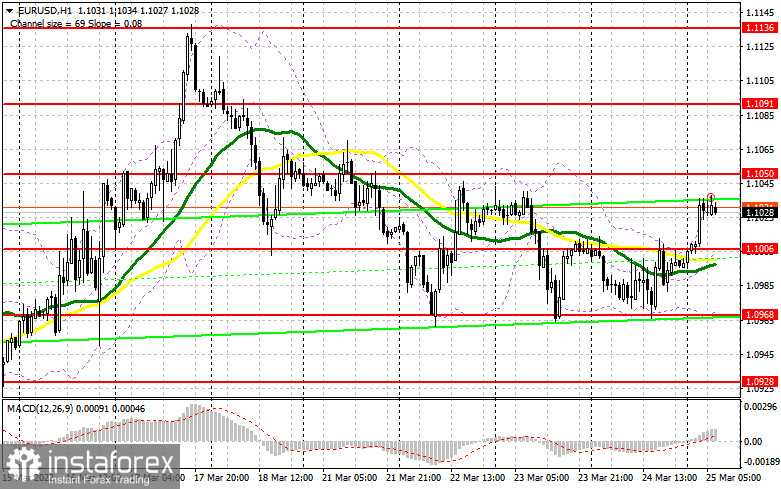
Trading is conducted just below the 30- and 50-day moving averages, which indicates that bears are still controlling the market. .
Note: The period and prices of moving averages are considered by the author on the one-hour chart that differs from the general definition of the classic daily moving averages on the daily chart.
Bollinger Bands
If the price rises, the upper limit of the indicator located at 1.1040 will act as a resistance level. In case of a decline, the lower limit of 1.0968 will act as a support level.
Description of indicators
- Moving average (moving average, determines the current trend by smoothing volatility and noise). The period is 50. It is marked in yellow on the chart.
- Moving average (moving average, determines the current trend by smoothing volatility and noise). The period is 30. It is marked in green on the graph.
- MACD indicator (Moving Average Convergence/Divergence - convergence/divergence of moving averages). A fast EMA period is 12. A slow EMA period is 26. The SMA period is 9.
- Bollinger Bands. The period is 20.
- Non-profit speculative traders are individual traders, hedge funds, and large institutions that use the futures market for speculative purposes and meet certain requirements.
- Long non-commercial positions is a total long position opened by non-commercial traders.
- Short non-commercial positions is a total short position opened by non-commercial traders.
- The total non-commercial net position is a difference between the short and long positions opened by non-commercial traders.