Here are the details of the economic calendar for October 4:
Last night, the volume of industrial orders in the United States for August was published, where there is an increase of 1.2%, which is higher than the forecasted 1.0%.
This indicator reflects the total number of orders for durable and non-durable goods in the manufacturing sector. This allows us to assess the level of activity in this area, which is an important indicator of the state of the economy. The high result strengthens the US dollar.
The market reacted positively, and the US dollar strengthened.
Analysis of trading charts from October 4:
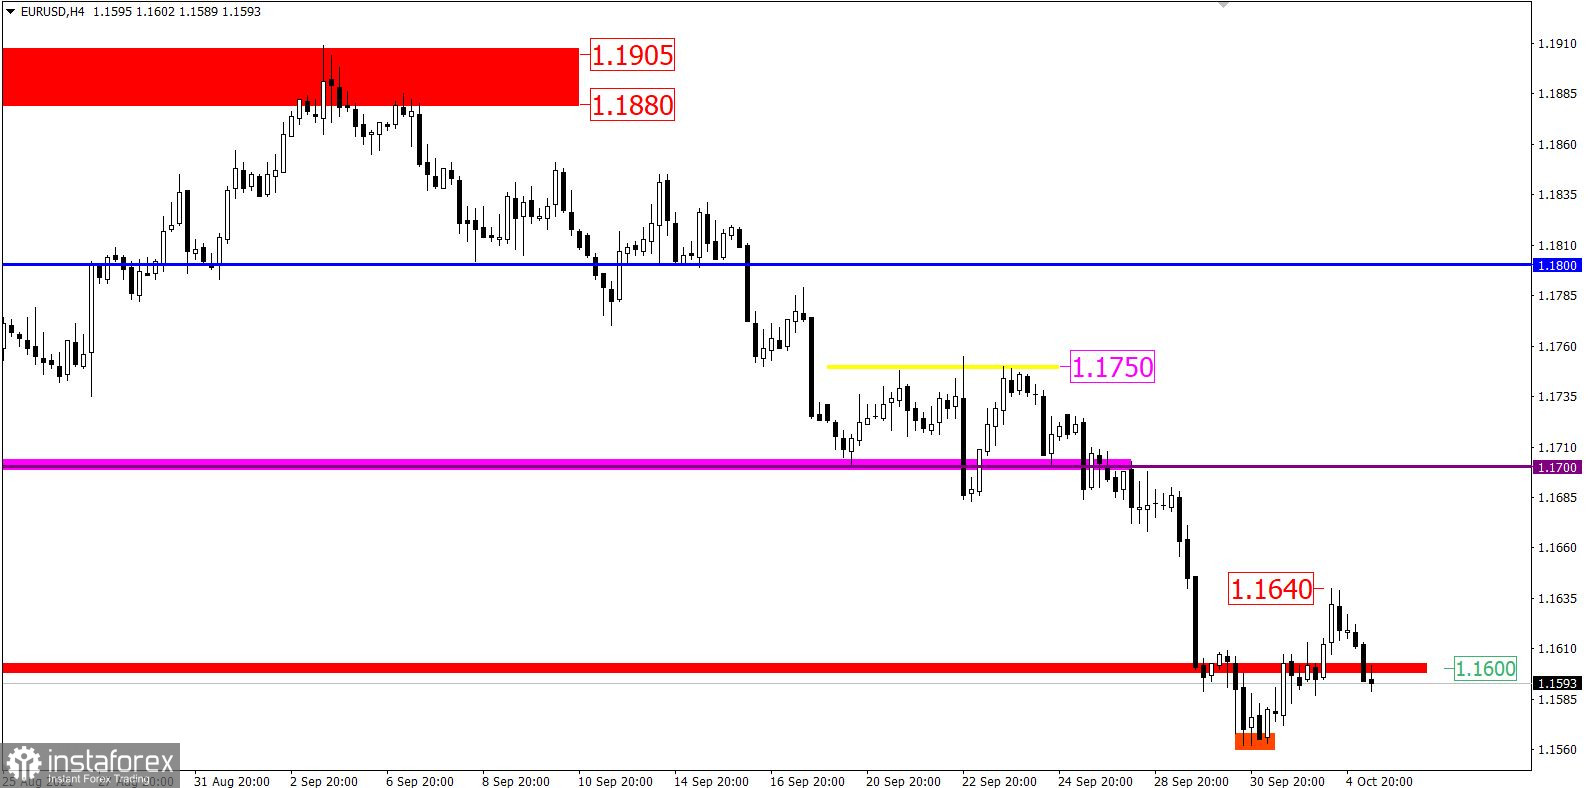
The EUR/USD pair reached the level of 1.1640 during the corrective movement from the pivot point of 1.1562, where there was a sharp fall in the volume of long positions. This led to a slowdown and continuation of the decline.
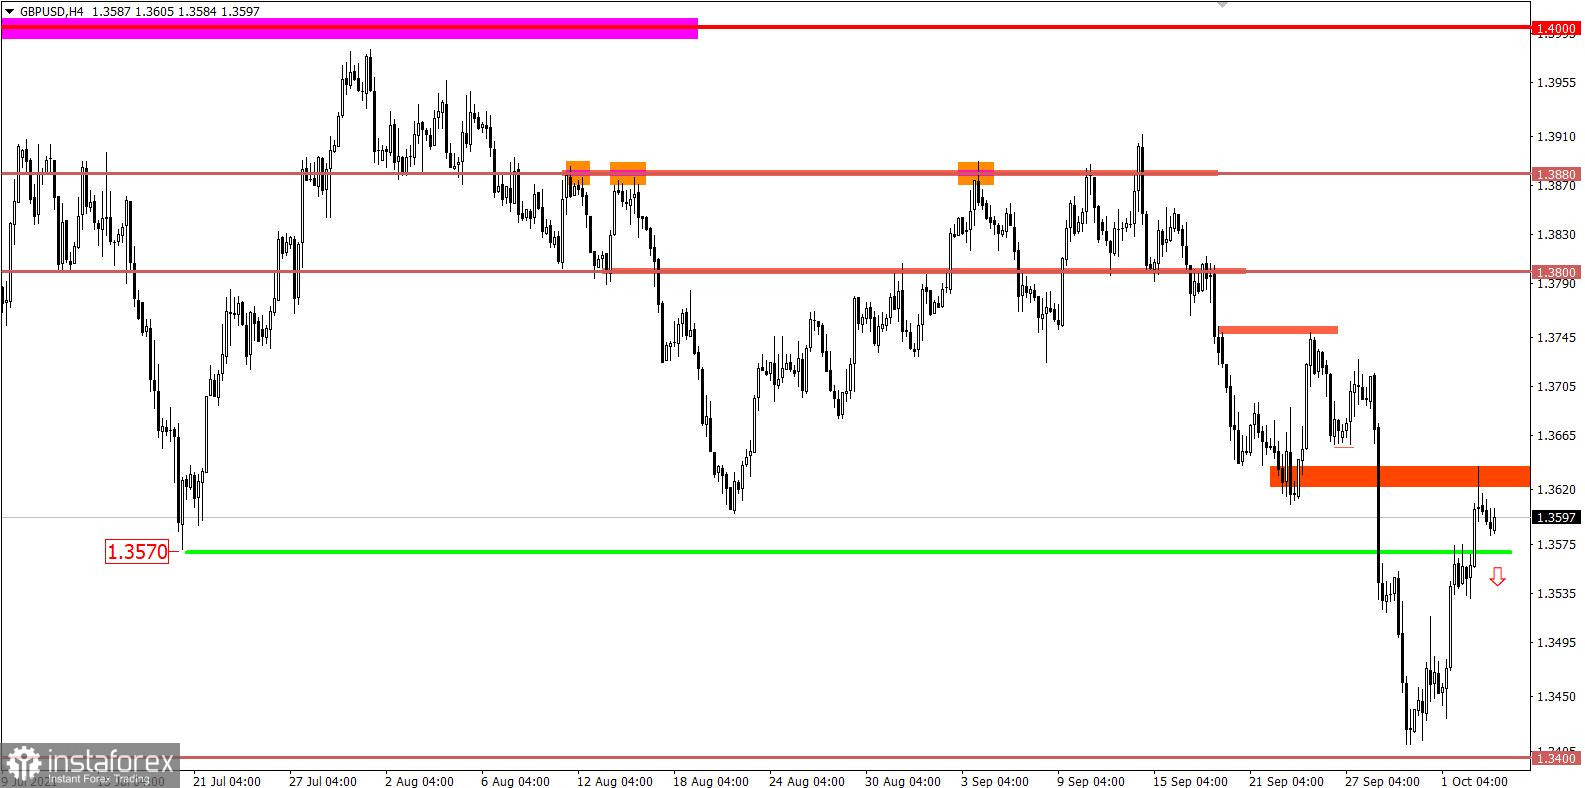
The GBP/USD pair follows a correctional scheme for three consecutive days, where the support level of 1.3400 serves as a pivot point. During this time, the pound has strengthened by more than 220 points.
Long positions or Long means buying positions in anticipation of an increase in the value of the asset.
* The support level is the so-called price coordinate, from which the quote can slow down or stop the downward course. The principle of constructing this level is to reduce the points of support on the history of the chart, where the price reversal in the market has already taken place.
October 5 economic calendar:
The producer price index will be published today at 9:00 Universal time, which is expected to rise from 12.1% to 13.5%. This means that Europe's inflation growth will only continue. The data have both a positive and a negative effect, which can play on the growth of the Euro currency in the beginning, and then on its decline.
After that, the United States' ISM index of business activity in the service sector will be released at 14:00 Universal time, where its level is predicted to fall from 61.7 points to 60.0 in the period of September.
It can be recalled that the ISM business activity index is an important indicator of the state of the service sector in the United States economy.
Trading plan for EUR/USD on October 5:
An attempt to continue the downward cycle is currently visible, which jeopardizes the breakdown of the local low of 1.1562. It can be assumed that keeping the price below the level of 1.1600 will increase the chance of sellers going below the low of 1.1562. The greatest attention from traders will arise once the price consolidates below the level of 1.1550. This will lead to a subsequent increase in the volume of short positions and prolongation of the downward cycle.
Trading plan for GBP/USD on October 5:
The level of 1.3640 acts as a variable resistance level on the correction path, relative to which there was a slowdown in the upward course. It can be assumed that holding the price below the level of 1.3565 may start the process of resuming the downward cycle. This step will lead to the breakdown of the support level of 1.3400.
An alternative scenario for the development of the market considers the prolongation of the corrective course in case the price is kept above the level of 1.3640. In this case, a movement towards 1.3700 is not excluded, where the overbought status of the pound sterling will arise.
What is reflected in the trading charts?
A candlestick chart view is graphical rectangles of white and black light, with sticks on top and bottom. When analyzing each candle in detail, you will see its characteristics of a relative period: the opening price, closing price, and maximum and minimum prices.
Horizontal levels are price coordinates, relative to which a stop or a price reversal may occur. These levels are called support and resistance in the market.
Circles and rectangles are highlighted examples where the price of the story unfolded. This color selection indicates horizontal lines that may put pressure on the quote in the future.
The up/down arrows are the reference points of the possible price direction in the future.
Golden Rule: It is necessary to figure out what you are dealing with before starting to trade with real money. Learning to trade is so important for a novice trader because the market is constantly dynamic and it is important to understand what is happening.