Long positions on EUR/USD:
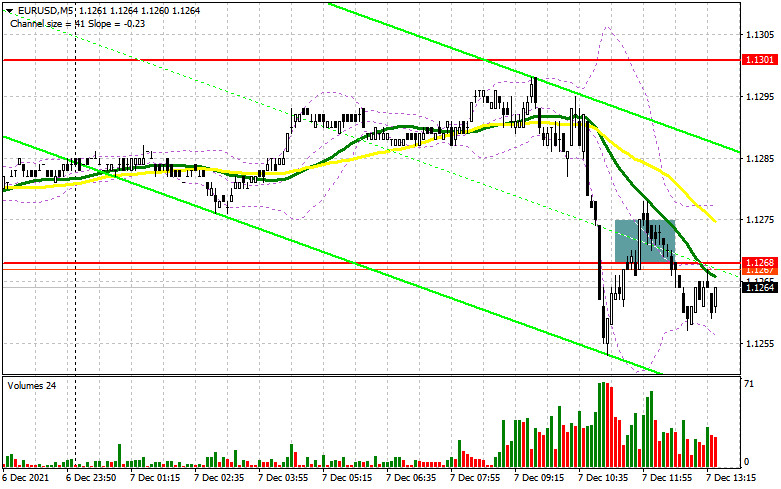
In my forecast this morning, I drew attention to the level of 1.1268 and recommended opening positions from this level. Let's look at the 5-minute chart and analyze the situation. The statistics from the ZEW institute, an index of business sentiment in Germany and the Eurozone, as expected, put pressure on the euro, and as a result, the pair broke out and fixed below 1.1268. The retest of this level formed a sell signal, which is still relevant at the moment. The technical picture has slightly changed. As long as the pair is trading below 1.1268, the euro is likely to decline.

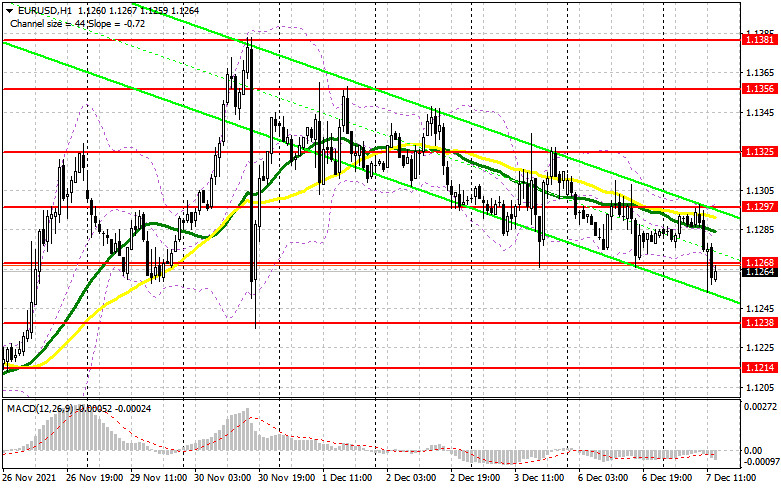
In the afternoon there are no important fundamental statistics. Reports on the trade balance and the nonfarm productivity in the US are unlikely to provide serious support for euro buyers, so the pair is likely to decline. However, bulls should not despair. If they manage to regain control over 1.1268, the situation may change in their favor. Only a breakout and a fixation above 1.1268 with a reverse top/bottom test may create an entry point with the EUR/USD growth target near the middle boundary of the sideways channel located at 1.1297, which the price failed to break through this morning. A breakout of this trading range, along with weak data on the US consumer credit, may trigger a larger upward correction to the weekly high at 1.1325, where traders are recommended to generate profit. The next target is located at 1.1356. If in the second half of the day the pressure on the euro remains, it is better to postpone opening long positions. I would advise you to wait for a false breakout near support at 1.1238, because the pair is likely to be trading against the bearish trend, and catching the lows is not what you want to do. This scenario may form a good entry point into long positions. If bulls are not active at this level as well, it is best to postpone the sale until the price reaches larger support at 1.1214. I also recommend buying the euro on the rebound from the low at 1.1188, or even lower around 1.1155, allowing an upward intraday correction of 20-25 pips.
Short positions on EUR/USD:
Bears managed to break through support at 1.1268 this morning. The retest of a new weekly low may keep bearish sentiment. Even if the euro grows in the second half of the day, it is unlikely to change the situation. An important task for the sellers during the New York session is to hold the price below resistance at 1.1268. Moving averages are located above this level, which also plays on the side of bears. A false breakout of this level, after the US economic data release, may become a good entry point for opening short positions, counting on the continuation of bearish momentum, which was observed this morning. News that a number of European countries have already imposed restrictions due to a new strain of coronavirus may also put pressure on the euro and a growing number of cases might lead to a larger drop in the pair. Bears need to control the support at 1.1238, which the pair strives to reach now. If the pair breaks through this level and tests it from the bottom/top, it may create a signal for opening short positions with the target located in the area of 1.1214. The next target is support at 1.1188, where I recommend generating profit. If the euro grows in the second half of the day and there is no activity of bears at 1.1268, it is better to postpone selling the pair. It is better to open short positions after a false breakout at 1.1297. It is possible to open short positions on the rebound from the highs located at 1.1325 and 1.1356, allowing a downward correction of 15-20 pips.

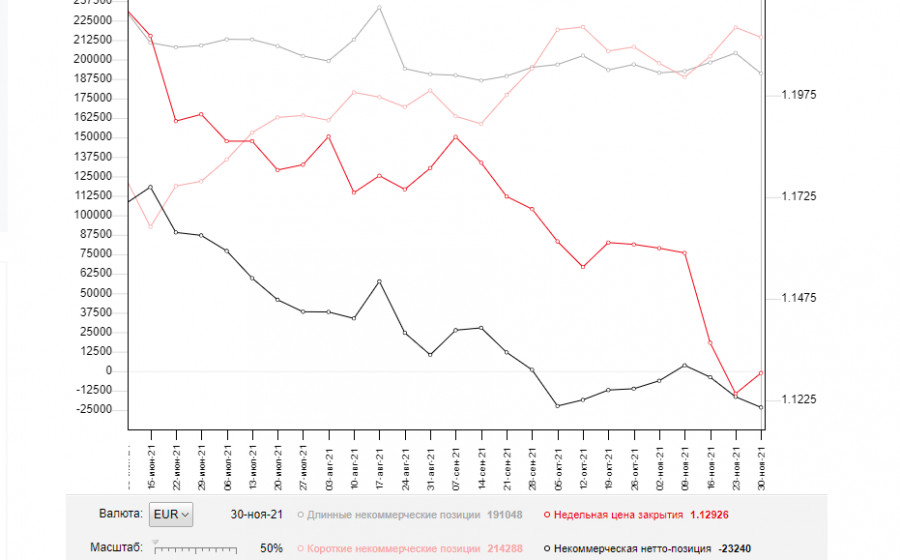
The COT report (Commitment of Traders) for November 30 shows a decline in both short and long positions. However, the contraction in long positions still remained higher, which led to an increase in the negative delta. Last week, there were a lot of speeches by Federal Reserve Chairman Jerome Powell, who commented about an expected tightening of the monetary policy. The reason for this was the fairly high inflation rate, which has gone from "transitory" to permanent, which creates a lot of problems for the central bank. The second problem was the new variant of coronavirus, which is likely to slow down the world economy late this year and early next year, which also refrains buyers from risky assets. Next week, the Federal Reserve will decide on the asset-buying program, so demand for the US dollar is expected to persist in the shorter term. The latest November COT report indicated that long non-commercial positions fell to 191,048 from 204,214, while short non-commercial positions plunged to 214,288 from 220,666. At the end of the week, total non-commercial net positioning increased to -23,240 against -16,452. The weekly closing price, on the other hand, reached much higher to 1.1292 against 1.1241.

Indicator signals:
Moving averages
Trading is carried out just above the 30 and 50 moving averages, which indicates bearish sentiment in the market.
Note: The period and prices of moving averages are considered by the author on the H1 hourly chart and differ from the general definition of the classic daily moving averages on the daily D1 chart.
Bollinger Bands
If the pair grows, the resistance will be located at the upper boundary of the indicator at 1.1297.
Description of indicators:
- Moving average (moving average, determines the current trend by smoothing out volatility and noise). Period 50. It is marked in yellow on the chart.
- Moving average (moving average, determines the current trend by smoothing out volatility and noise). Period 30. It is marked in green on the chart.
- MACD indicator (Moving Average Convergence/Divergence — convergence/divergence of moving averages) Quick EMA period 12. Slow EMA period to 26. SMA period 9
- Bollinger Bands (Bollinger Bands). Period 20
- Non-commercial speculative traders, such as individual traders, hedge funds, and large institutions that use the futures market for speculative purposes and meet certain requirements.
- Long non-commercial positions represent the total long open position of non-commercial traders.
- Short non-commercial positions represent the total short open position of non-commercial traders.
- Total non-commercial net position is the difference between short and long positions of non-commercial traders.


