What is needed to open long positions on EUR/USD
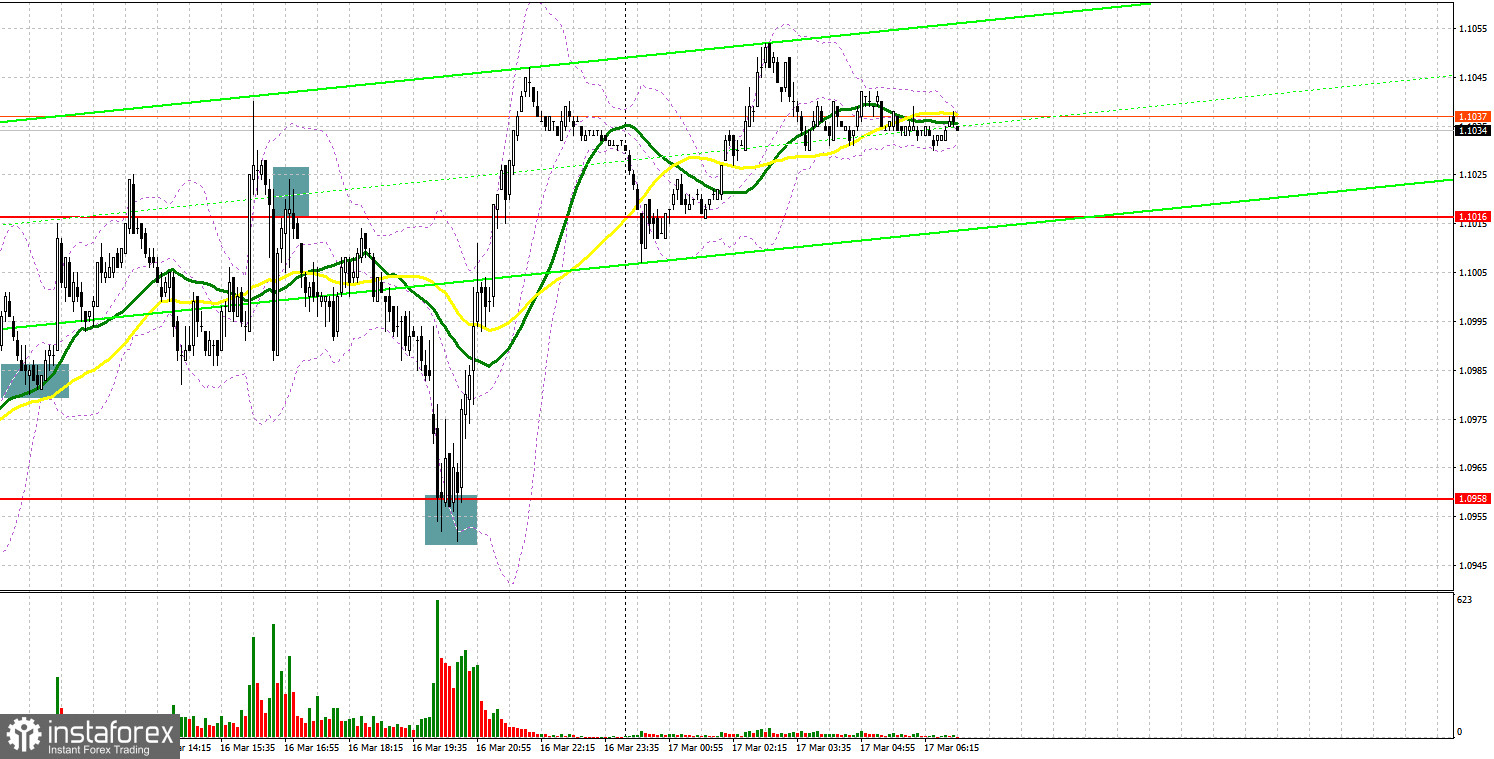
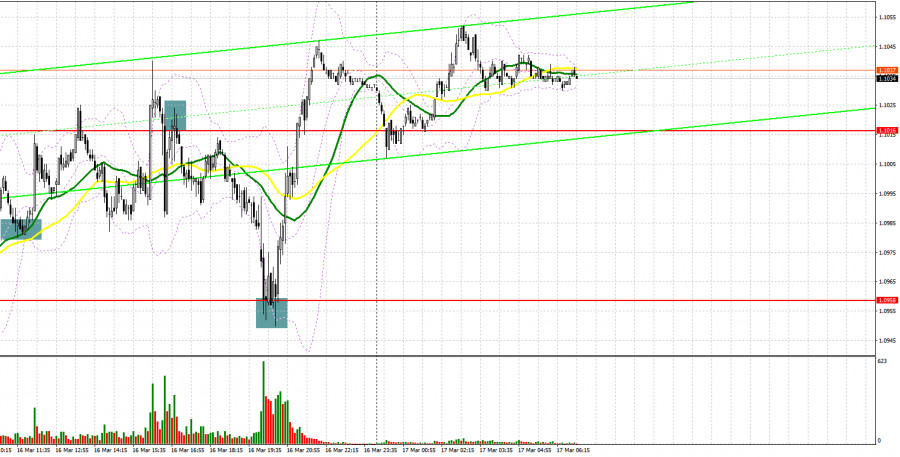
Yesterday, EUR/USD provided some strong signals for market entry. Let's take a look at the 5-minute chart and try to figure out what has actually happened. In the morning article, I highlighted 1.0984 and recommended making trading decisions with this level in focus. In the second half of the day, the euro bulls pushed the pair to 1.0984 amid the empty economic calendar. Then, the bulls broke this level with a test downwards. It was a logical market response. Following this signal, EUR/USD climbed about 50 pips and bumped into one-week highs. In the second half of the day, the bears managed to protect resistance at 1.1016. The price return to this level and its test upwards generated a good sell signal. As a result, before the Fed's announcements on interest rates, the currency pair dropped 60 pips. The Fed's policy decisions came as no surprise. So, a false breakout at 1.0958 have an excellent entry point for long positions that brought a profit of more than 90 pips.
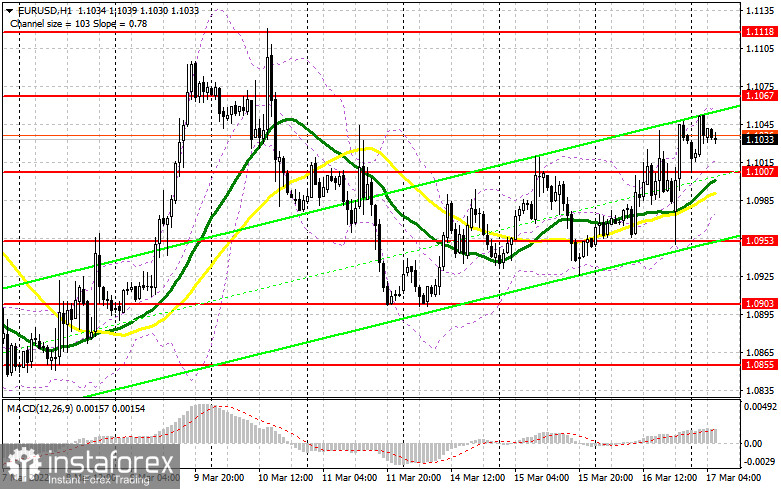
EUR/USD is still trading higher because the Fed's make a predictable policy decision. Everything was going according to the consensus. FOMC policymakers headed by Chairman Jerome Powell voted 8-1 for raising the funds rate to 0.25% - 0.50%. It is the first rate hike since 2018. Today, the economic calendar lacks macroeconomic statistics in the first half of the day. Hence, the euro buyers have a good chance to continue the upward correction and test resistance at 1.1067.
The equally important task for the bulls will be protection of support at 1.1007 that was formed yesterday. Moving averages are passing below this level. They are benefitting the buyers, thus contributing to a further rise of EUR/USD. A false breakout at this level generates the first entry point for long positions. To see a large move upwards, EUR/USD has to trade actively and break resistance at 1.1067. A test of this level downwards will give a buy signal and open the door to 1.1118, a major resistance that could change market sentiment on favor of the buyers. A more distant target is seen at 1.1165 where I recommend profit taking. A breakout of this level will terminate the bearish trend and activate stop orders of the sellers. The door will be open to highs at 1.1227 and 1.1271. Notably, this scenario will come into play on condition of good news about the Russia – Ukraine talks. Some signs of progress will ease geopolitical tensions around the world. In case EUR/USD falls and the bulls lack activity at 1.1007, it would be better to cancel long positions. The reasonable scenario for long positions will be a false breakout of lows at around 1.0953. We could open long positions immediately at a bounce off 1.0903, bearing in mind a 30-35-pips intraday upward correction.
What is needed to open short positions on EUR/USD
Yesterday the bears tried to assert strength, but actually things went wrong. Eventually, the bears lost control. They have to do their best to prevent a further large upward correction. The euro bulls could set the tone in the first half of the day. So, I would recommend selling from higher major levels. The euro sellers should think about how they can protect the nearest resistance of 1.1067. A fake breakout there would generate a sell signal in view to sliding towards support at 1.1007. A lot will depend on this support today. This breakout is likely to happen in case of another price reversal with the aim of activating stop orders of speculative buyers who opened long positions after the Fed's policy meeting. An opposite test upwards of 1.1007 might happen soon, thus giving an extra signal to open short positions in view to falling towards 1.0953 and 1.0903. A deeper target is seen at 1.0855.
In case the euro grows and the bears lack activity at 1.1067, the bulls will increase long positions. Earlier, the bulls were encouraged by the ECB intention to embark on monetary tightening and raise interest rates in October this year. With such prospects, it would be better to rush selling the currency pair. The reasonable scenario will be opening short positions at a false breakout at about 1.1118. We could sell EUR/USD immediately at a drop off 1.1165 or higher off 1.1227, bearing in mind a 15-20-pips downward correction.
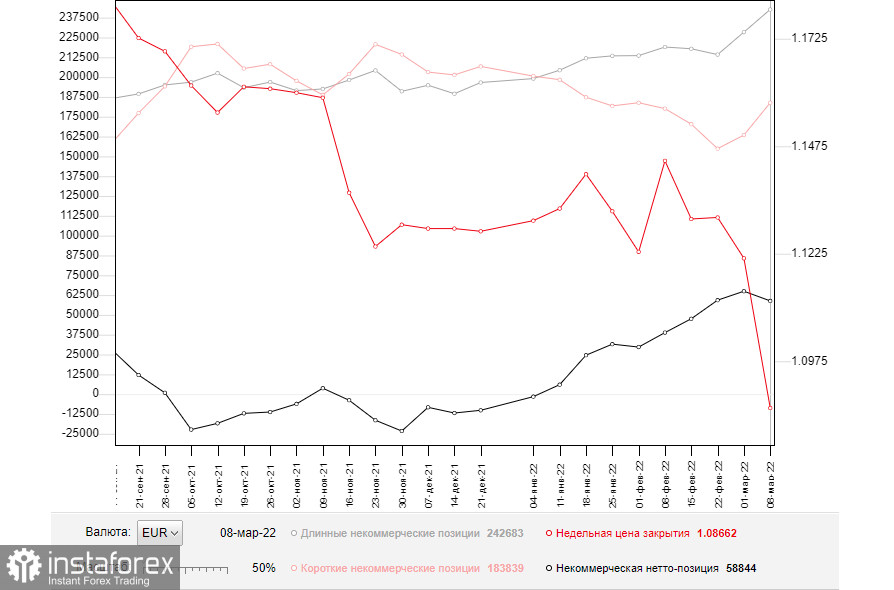
The COT report from March 8 logs an increase in both long and short positions. No wonder, traders preferred to sell the pair amid Russia's hostilities in Ukraine. It contracted a positive delta. There is something that makes me surprise. Despite a significant decline of EUR, the buyers did not give up but went on increasing long positions, taking advantage of lower prices. Last week, the ECB cleared up its stance on further monetary policy. This cements confidence of buyers of risky assets under complicated geopolitical conditions. Let me remind you that Christine Lagarde unveiled the plans about more aggressive withdrawal of economic stimulus and raising interest rates. This rhetoric is viewed as a strong bullish medium-term signal for EUR buyers.
The focal point this week is certainly the FOMC policy meeting. The central bank is widely expected to take counter-measures against soaring inflation that surged to the highest levels over the last 40 years. Investors doubt whether the Fed will take efficient measures. Another catalyst for market sentiment is the ongoing talks between Russia and Ukraine, though a few rounds have ended in nothing.
Amid such fundamental background, I would recommend buying the US dollar because EUR/USD is still trading with the overall downtrend. According to the latest COT report, long non-commercial positions grew from 228,458 to 242,683 whereas short non-commercial positions grew from 163,446 to 183,839. The overall non-commercial net positions contracted to 58,844 against 64,939 a week ago. EUR/USD closed last week much lower at 1.1214 against the closing price of 1.0866 a week ago.
Indicators' signals:
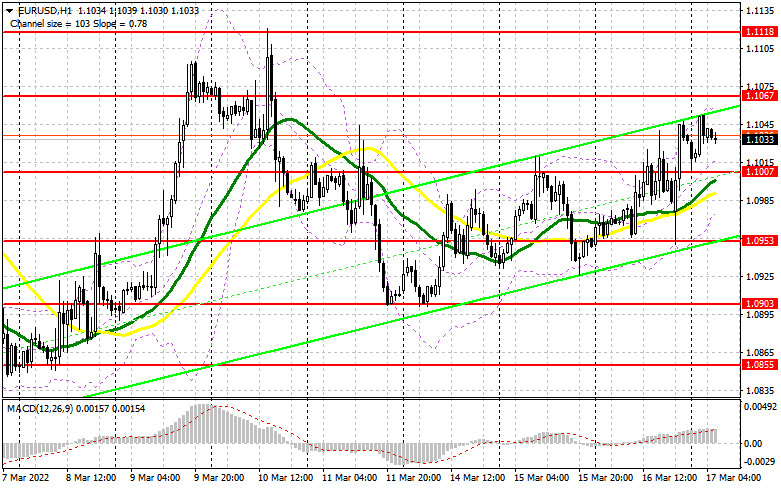
Trading is carried out above the 30 and 50 daily moving averages. It indicates that the bulls are pushing the price up.
Moving averages
Note: The period and prices of moving averages are considered by the author on the H1 hourly chart and differs from the general definition of the classic daily moving averages on the daily D1 chart.
Bollinger Bands
If EUR/USD grows, the indicator's upper border at 1.1050 will serve as resistance. Otherwise, if the currency pair falls, the lower border at nearly 1.0975 will serve as support.
Description of indicators
- Moving average (moving average, determines the current trend by smoothing out volatility and noise). Period 50. It is marked yellow on the chart.
- Moving average (moving average, determines the current trend by smoothing out volatility and noise). Period 30. It is marked green on the chart.
- MACD indicator (Moving Average Convergence/Divergence — convergence/divergence of moving averages) Quick EMA period 12. Slow EMA period to 26. SMA period 9
- Bollinger Bands (Bollinger Bands). Period 20
- Non-commercial speculative traders, such as individual traders, hedge funds, and large institutions that use the futures market for speculative purposes and meet certain requirements.
- Long non-commercial positions represent the total long open position of non-commercial traders.
- Short non-commercial positions represent the total short open position of non-commercial traders.
- Total non-commercial net position is the difference between short and long positions of non-commercial traders.