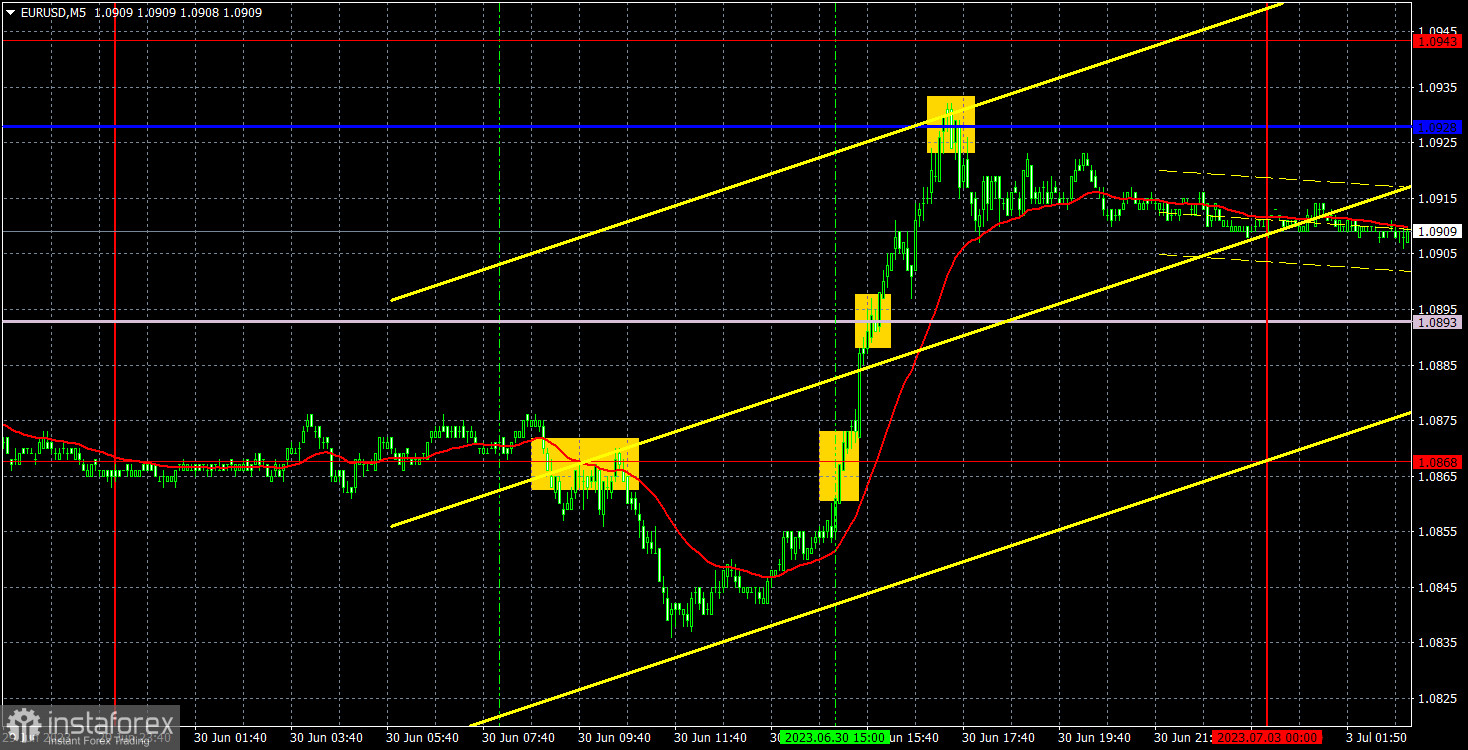
5M chart of EUR/USD
EUR/USD tried to extend its bearish bias on Friday, but it started to rise during the European trading session. Take note that the EU released an important inflation report for June (preliminary value). It revealed that the headline consumer price index decreased to 5.5%, which was generally in line with expectations. However, core inflation increased to 5.4%, which also met expectations. Nevertheless, the figures themselves can still be considered quite significant. Inflation continues to decline, and there are no questions about that. However, at the same time, core inflation continues to rise or, rather, it is hardly declining. Since the European Central Bank has repeatedly emphasized the importance of the core indicator, it is very difficult to draw a definitive conclusion: is inflation in the EU falling or rising?
The euro initially fell after the report, but then it eventually traded higher again, which may not be directly related to macro data. Let's put it this way: there were no grounds for a sharp upward reversal on Friday. The first sell signal was formed around the level of 1.0868 and could only bring profit if the trade was manually closed, as the pair dropped about 20 pips. Then, a buy signal was formed around the same level, which was much more interesting. The price rose to a critical line, and you could take profit near it, amounting to at least 40 pips.
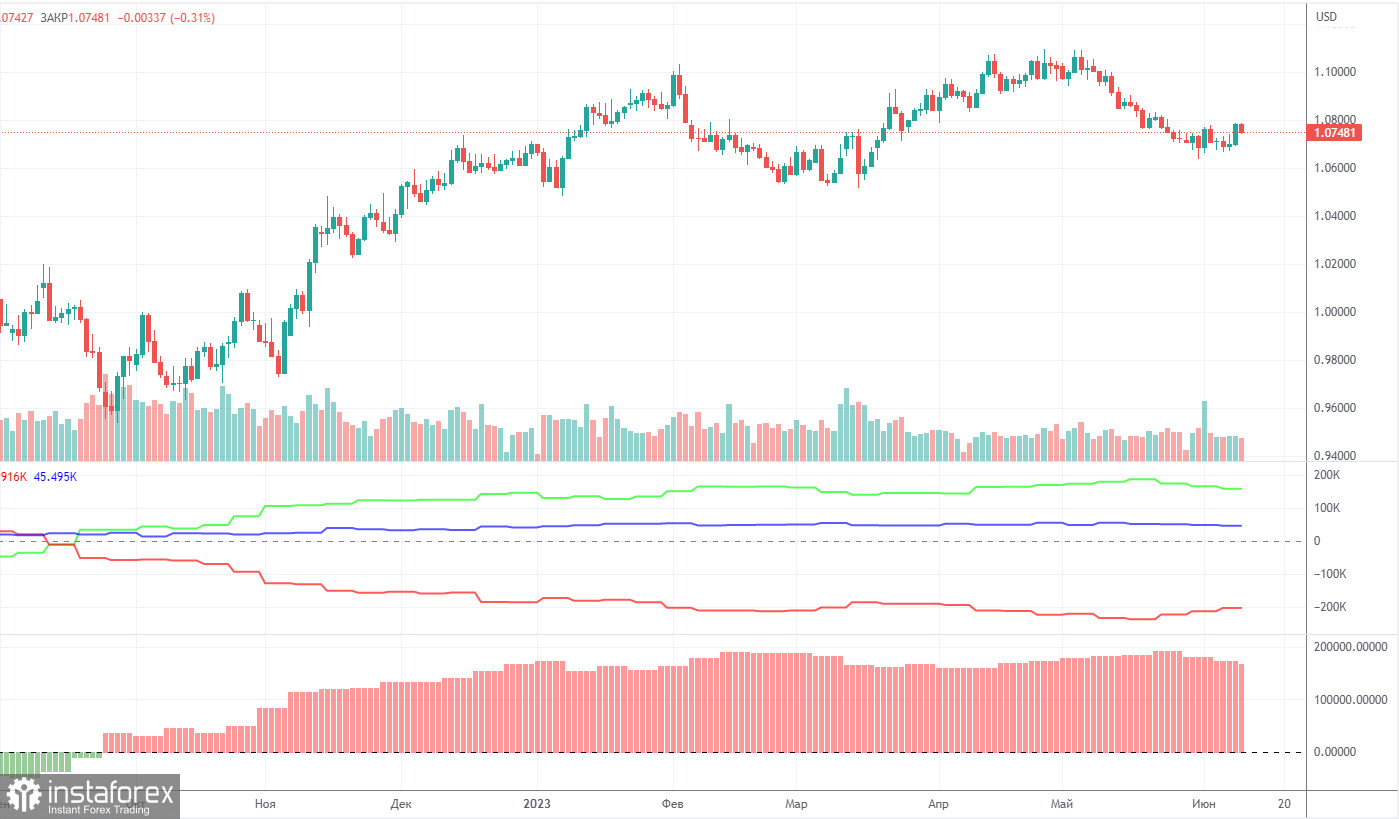
COT report:
A new COT report for June 27 was released. In the last 10 months, COT reports have fully corresponded to what is happening on the market. The chart above clearly shows that the net position of big traders (the second indicator) began to grow again in September 2022. At the same time, the euro resumed an upward movement. The net position of non-commercial traders is bullish. The euro is trading at its highs against the US dollar. I have already mentioned that a fairly high value of the "net position" indicates the end of the uptrend. The first indicator also signals such a possibility as the red and green lines are very far from each other. It often occurs before the end of the trend. The euro tried to start falling in early May but there was only a pullback.
During the last reporting week, the number of long positions of the "non-commercial" group of traders increased by 5,400 and the number of short positions rose by 5,800. Accordingly, the net position fell by 400 contracts. The number of long positions is 145,000 higher than short ones. The difference is more than three times. The correction has begun. Yet, it may not be a correction but the start of a new downtrend. At the moment, even without the COT reports, it is clear that the pair should continue to decline.
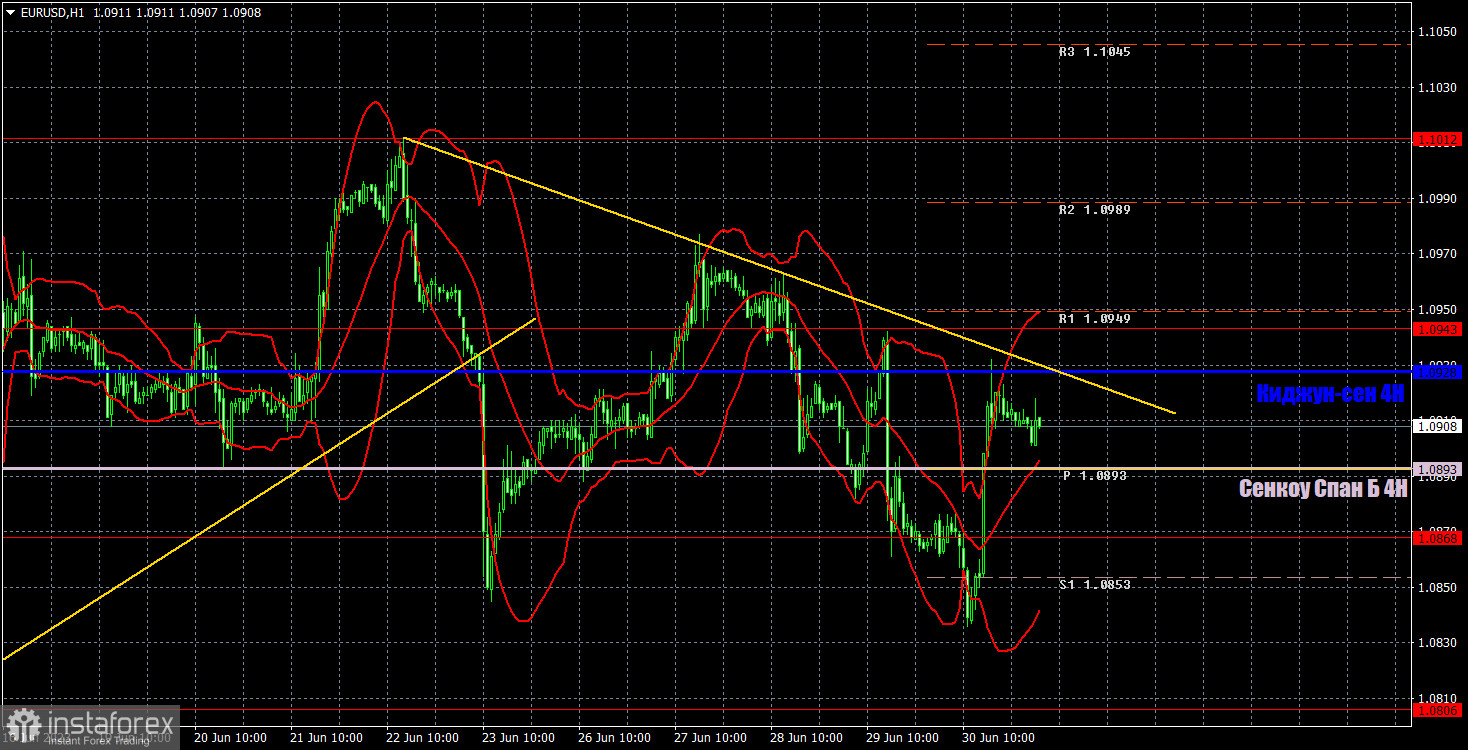
1H chart of EUR/USD
In the 1-hour chart, the pair is trading lower, forming a new downtrend line. Currently, the pair has corrected towards the Ichimoku indicator lines, indicating a potential reversal to the downside and a revival of the downtrend. We believe that now is a good time for a new downward phase in the medium term, but still within the range of 1.05-1.11.
On July 3, trading levels are seen at 1.0658-1.0669, 1.0762, 1.0806, 1.0868, 1.0943, 1.1012, 1.1092, 1.1137, as well as the Senkou Span B line (1.0893) and the Kijun-sen line (1.0928). Ichimoku indicator lines can move intraday, which should be taken into account when determining trading signals. There are also support and resistance although no signals are made near these levels. Signals could be made when the price either breaks or bounces from these extreme levels. Do not forget to place Stop Loss at the breakeven point when the price goes by 15 pips in the right direction. In case of a false breakout, it could save you from possible losses.
Today, PMIs in the manufacturing sectors will be published for the European Union, Germany, and the United States. You should pay attention to the ISM index in the United States.
Indicators on charts:
Resistance/support - thick red lines, near which the trend may stop. They do not make trading signals.
Kijun-sen and Senkou Span B are the Ichimoku indicator lines moved to the hourly timeframe from the 4-hour timeframe. They are also strong lines.
Extreme levels are thin red lines, from which the price used to bounce earlier. They can produce trading signals.
Yellow lines are trend lines, trend channels, and other technical patterns.
Indicator 1 on the COT chart is the size of the net position of each trader category.
Indicator 2 on the COT chart is the size of the net position for the Non-commercial group of traders.