What is needed to open long positions on EUR/USD
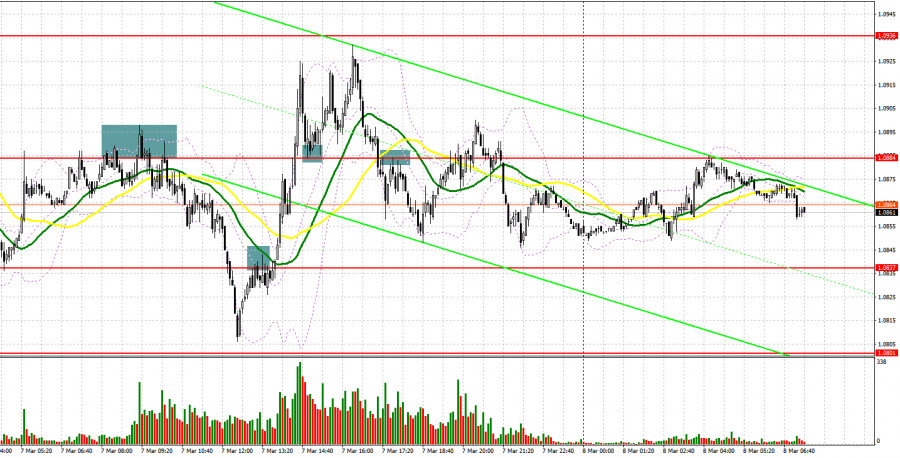
Yesterday, EUR/USD produced a lot of profitable signals to enter the market despite the fact that the currency pair was trading mainly sideways. Let's have a look at the 5-minute chart and figure out what actually happened. In yesterday's article, I turned your attention to 1.0884 and recommended taking trading decisions with this level in focus. Traders took no notice of nice statistics from Germany. The price made a false breakout of 1.10884 as expected and generated a sell signal. The EU business sentiment index came in much worse than expected, thus causing another sell-off of EUR, pushing the price towards 1.0844. Hence, traders took a profit of nearly 40 pips. A breakout and an opposite test of 1.0844 produced a signal to open short positions. However, I didn't see a massive sell-off of EUR. As a result, stop loss orders were activated. In the American session, EUR perked up. A breakout and an opposite test of 1.0884 gave an excellent signal to enter the market with long positions. So, I had an opportunity to take profit of 45 pips at 1.0936. Then the price retreated to 1.0884, this generating a good point for short positions. The pair fell 30 pips.

EUR/USD remains in a range as traders are looking forward to some solution in the Russia – Ukraine conflict. Traders foresee a correction that could occur anytime. As a result of the third round of the talks, the parties agreed on arranging humanitarian corridors for civilians to abandon some Ukrainian cities and towns.
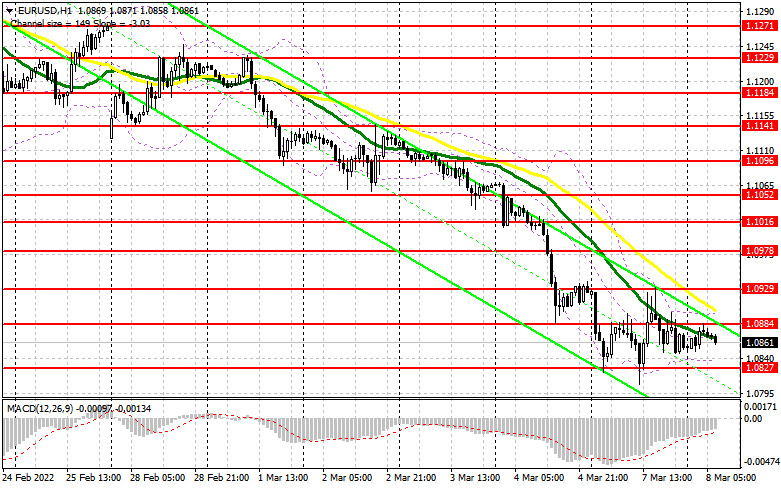
The question is open whether such agreement would be ever fulfilled. Today the economic calendar has a series of data from the EU that could help the buyers to fix the price at current lows. The major task for the bulls in the first half of the day is to defend support at 1.0827 formed yesterday. EUR/USD could create the first point for long positions on condition of a false breakout at the above-said level alongside strong statistics on German industrial production, GDP, and the eurozone's employment. We could project a rebound towards 1.0884. This is the level where moving averages are passing, thus playing in the bear's favor. So, the buyers will face trouble. To see a more robust move of EUR/USD, resistance should be broken. A test of 1.0884 downwards will generate a buy signal and open the door towards 1.0929, yesterday's high. A breakout of this level will bring the bearish trend to a halt and trigger sellers' stop loss orders. The door will be open towards higher highs at 1.0978 and 1.1016 where I recommend profit taking. If Kyiv and Moscow aren't committed to their agreement and the geopolitical crisis escalates, the US dollar will enjoy buoyant demand. In this case, the best scenario would be buying the pair at a false breakout of 1.0772, a new one-month low. We could open long positions on EUR/USD immediately at a drop from lower levels of 1.0728 and 1.0636, bearing in mind a 20-25-pips upward correction intraday.
What is needed to open short positions on EUR/USD
Yesterday, the bears sent a message that they would tolerate any correction. To confirm this, we saw active selling at 1.0929. Weak data on the eurozone today might cancel long positions on EUR as traders would be discouraged by a slowdown in the EU at the end of 2021. If GDP is downgraded, the bears will succeed defending the nearest resistance at 1.0884. A false breakout there would suggest opening short positions with the downward target at 1.0827. A breakout and an opposite test of this level could happen soon. It will create an extra signal to open short positions with the prospects of a fall towards new one-year lows at 1.0772 and 1.0728. Once they are tested, the door will be open towards 1.0636 where I recommend profit taking.
The thing is that such a massive sell-off is possible on condition of very negative news from Ukraine. In case EUR grows and the bears lack activity at 1.0884, it would be better not to rush selling the pair. Perhaps, the bulls could trade more aggressively like yesterday in case of upbeat data from Germany. A breakout of this level will activate stop loss orders of Asian sellers. Therefore, the reasonable scenario would be short positions during a false breakout at 1.0929. We could sell EUR/USD immediately at a bounce at 1.0978 or higher at about 1.1016, bearing in mind a 15-20-pips downward correction intraday.

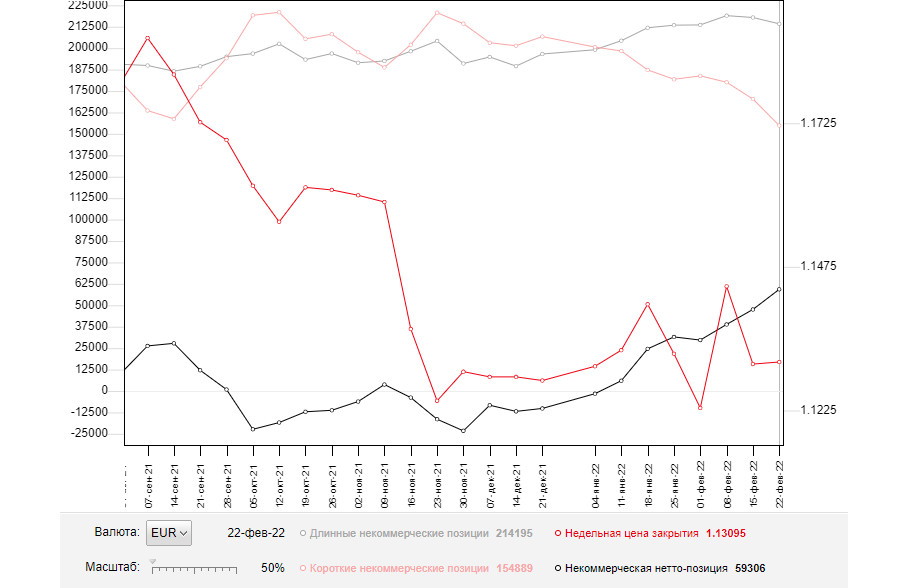
The COT report from February 22 again logs contraction of both long and short positions that increased a positive delta. Notably, short positions were much fewer. On the back of the severe geopolitical conflict that affected the whole world it doesn't make sense to speculate on further policy moves of the ECB or the Federal Reserve. Indeed, if geopolitical tensions get worse, monetary policy moves will be of no importance. Now Russia and Ukraine are holding the talks. So, market sentiment will entirely depend on the outcome. Markets are anticipating a few rounds of the talks. Under such conditions, COT reports are taking the back seat. They are commonly of secondary importance for traders. I would strongly advise you to trade risky assets cautiously for the time being. It would be better to buy EUR at some signs of easing tensions among Russia, Ukraine, the US, and the EU. Any new sanctions towards Russia would entail grave economic consequences that will put a strain on financial markets and hurt not only the ruble but the single European currency. EUR could be bruised by the Kremlin's retaliatory measures that will be strongly dislikes by the EU. So, it will be another headwind for EUR.
According to the COT report, long non-commercial positions slipped from 217,899 to 214,195 whereas short non-commercial positions fell from 170,318 to 155,889. It means that fewer traders are willing to sell EUR but the buyers are not getting more numerous. It seems traders prefer to sit back during the political turbulence. All in all, the overall non-commercial net positions grew to 59,306 last week against 47,581 a week ago. EUR/USD closed nearly flat last week at 1.1309 against 1.1305 on the previous week.
Indicators' signals:
Trading is carried out below the 30 and 50 daily moving averages. It confirms the ongoing bearish trend.
Moving averages
Note: The period and prices of moving averages are considered by the author on the H1 hourly chart and differs from the general definition of the classic daily moving averages on the daily D1 chart.
Bollinger Bands
If EUR/USD grows, the indicator's upper border at 1.0900 will serve as resistance. Alternatively, if EUR weakens, the indicators' lower border at 1.0830 will serve as support.
Description of indicators
- Moving average (moving average, determines the current trend by smoothing out volatility and noise). Period 50. It is marked yellow on the chart.
- Moving average (moving average, determines the current trend by smoothing out volatility and noise). Period 30. It is marked green on the chart.
- MACD indicator (Moving Average Convergence/Divergence — convergence/divergence of moving averages) Quick EMA period 12. Slow EMA period to 26. SMA period 9
- Bollinger Bands (Bollinger Bands). Period 20
- Non-commercial speculative traders, such as individual traders, hedge funds, and large institutions that use the futures market for speculative purposes and meet certain requirements.
- Long non-commercial positions represent the total long open position of non-commercial traders.
- Short non-commercial positions represent the total short open position of non-commercial traders.
- Total non-commercial net position is the difference between short and long positions of non-commercial traders.


