Long positions on GBP/USD:
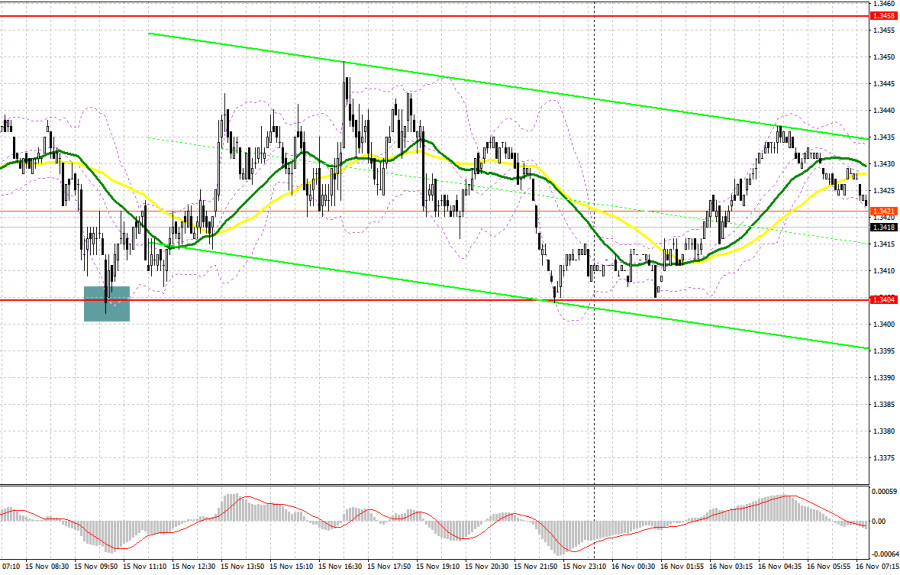
Yesterday, a strong buy signal was generated in the first half of the trading day. Let's look at the M5 chart and analyze entry points. In the morning review, the focus was on the level of 1.3404. I said you could go short from this mark. A correction after a sharp increase in the Asian session led to the formation of a false breakout at 1.3404. As a result, a buy signal was produced. The price rose by 40 pips but failed to reach the resistance level of 1.3458. In the second half of the trading day, the pair was traded sideways. Technically, nothing has changed as of today.

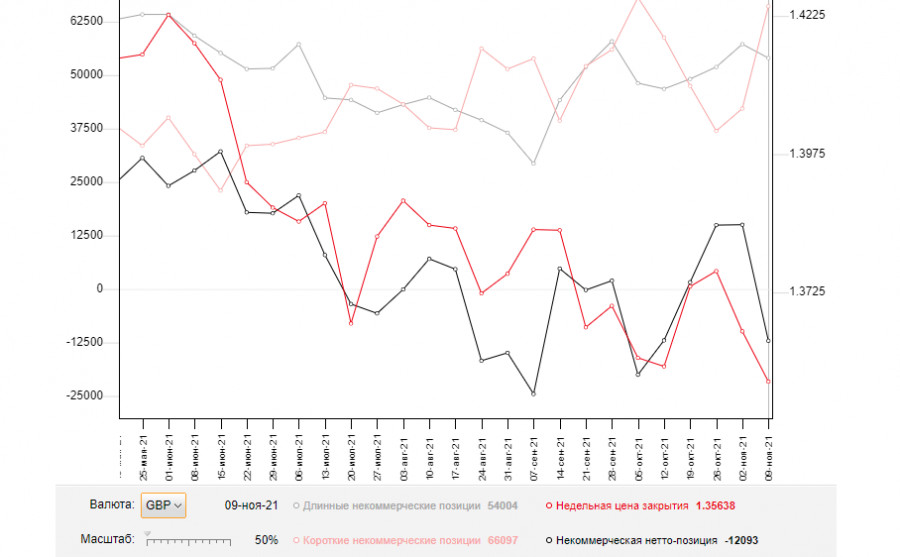
Before proceeding with GBP/USD outlook, let's look at what has happened in the futures market and see how the Commitments of Traders (COT) changed. The COT report as of November 9 logged an increase in short positions and a decrease in long ones, which led to a negative delta. Disappointing Q3 GDP results in the UK and a possible plunge in retail sales in Q4 amid a spike in inflation pushed the sterling down and exerted pressure on it. Another important factor for a bearish pound is the escalation of tension over the Northern Ireland protocol the British authorities plan to terminate in the near future. The European Union is preparing to introduce certain retaliatory measures. At the same time, inflation in the United States keeps rising, increasing the likelihood of earlier interest rate hikes, which provides support to the greenback. Nevertheless, I recommend sticking to the strategy of buying the pair after every large fall that is likely to occur amid uncertainty surrounding the central bank's monetary policy. According to the COT report, long non-commercial positions declined to 54,004 from 57,255 and short non-commercial positions increased to 66,097 from 42,208. The delta came at -12,093 versus 15,047 a week earlier. The weekly closing price dropped to 1.3563 from 1.3654 due to the Bank of England's stance on monetary policy.

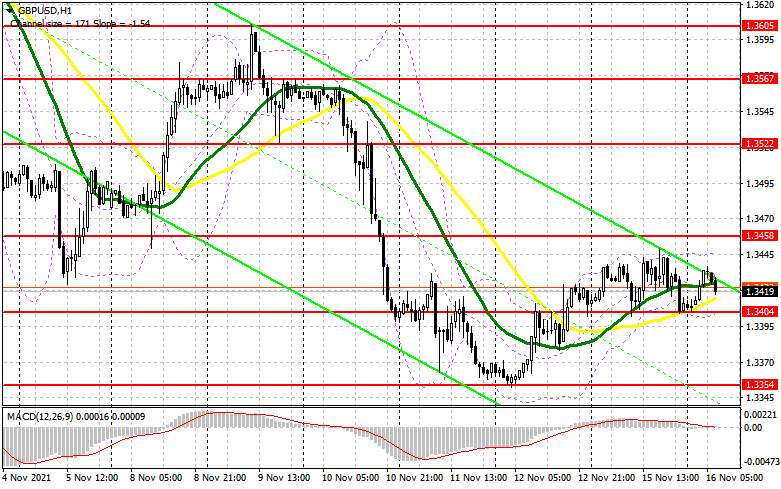
Today, the UK is expected to present its unemployment report and claimant count change data. The result could have a significant impact on the BoE's interest rate policy. In case of slow labor market recovery, the regulator may well change its monetary policy in the December meeting, which could result in a stronger pound sterling. Bulls' task for today will be to protect the level of 1.3404 in the first half of the day. A false breakout and a test of the moving averages there could give a signal to buy the pound against the trend. If so, the quote may retrace upward to 1.3458. Another important task will be to regain control over this level. A breakout and a retest of this mark top/bottom could produce an additional buy signal and push the pair to 1.3522 with the target at the high of 1.3567. Traders should consider locking in profits there. Otherwise, if the price goes down in the first half of the day, traders should consider buying the pair after a test of the support level of 1.3354. Nevertheless, long positions could be opened there only after a false breakout. Long positions on GBP/USD could also be considered on a bounce from the low of 1.3308 or the support level of 1.3254, allowing a 25-30 pips correction intraday.
Short positions on GBP/USD:
Bears failed to take control over the market yesterday. Today, they need to work hard to gain it. If the labor market data is ignored by market participants, a false breakout is likely to form at 1.3458, producing a sell entry point. Consequently, GBP/USD could fall to 1.3404. Pressure on the pair is expected to be limited by the moving averages located there. Therefore, it is important that bears break this range. A test at 1.3404 bottom/top is likely to produce an additional sell signal with targets at the lows of 1.3354 and 1.3308, where traders should consider locking in profits. Alternatively, if the pair goes up in the European session and there is a lack of bear activity at 1.3458, short positions could be opened only if the quote rises to the resistance level of 1.3522. Traders could also consider going short on a bounce from 1.3567 or the high of 1.3605, allowing a 20-25 pips correction intraday.
Indicator signals:
Moving averages
Trading is carried out above 30- and 50-period MAs, showing bulls' attempts to return to the market.
Important! The period and prices of moving averages are viewed by the author on the hourly H1 chart and differ from the general definition of classic daily moving averages on the D1 chart.
Bollinger Bands
The pair is likely to rise in case of a breakout of the upper band at 1.3444. A breakout of the lower band at around 1.3404 could increase pressure on the pair.
Indicator description:
- Moving average (MA) determines the current trend by smoothing volatility and noise. Period 50. Colored yellow on the chart.
- Moving average (MA) determines the current trend by smoothing volatility and noise. Period 30. Colored green on the chart.
- Moving Average Convergence/Divergence (MACD). Fast EMA 12. Slow EMA 26. SMA 9.
- Bollinger Bands. Period 20
- Non-commercial traders are speculators such as individual traders, hedge funds, and large institutions who use the futures market for speculative purposes and meet certain requirements.
- Long non-commercial positions are the total long position of non-commercial traders.
- Non-commercial short positions are the total short position of non-commercial traders.
- Total non-commercial net position is the difference between short and long positions of non-commercial traders.


