Friday Trade Analysis:
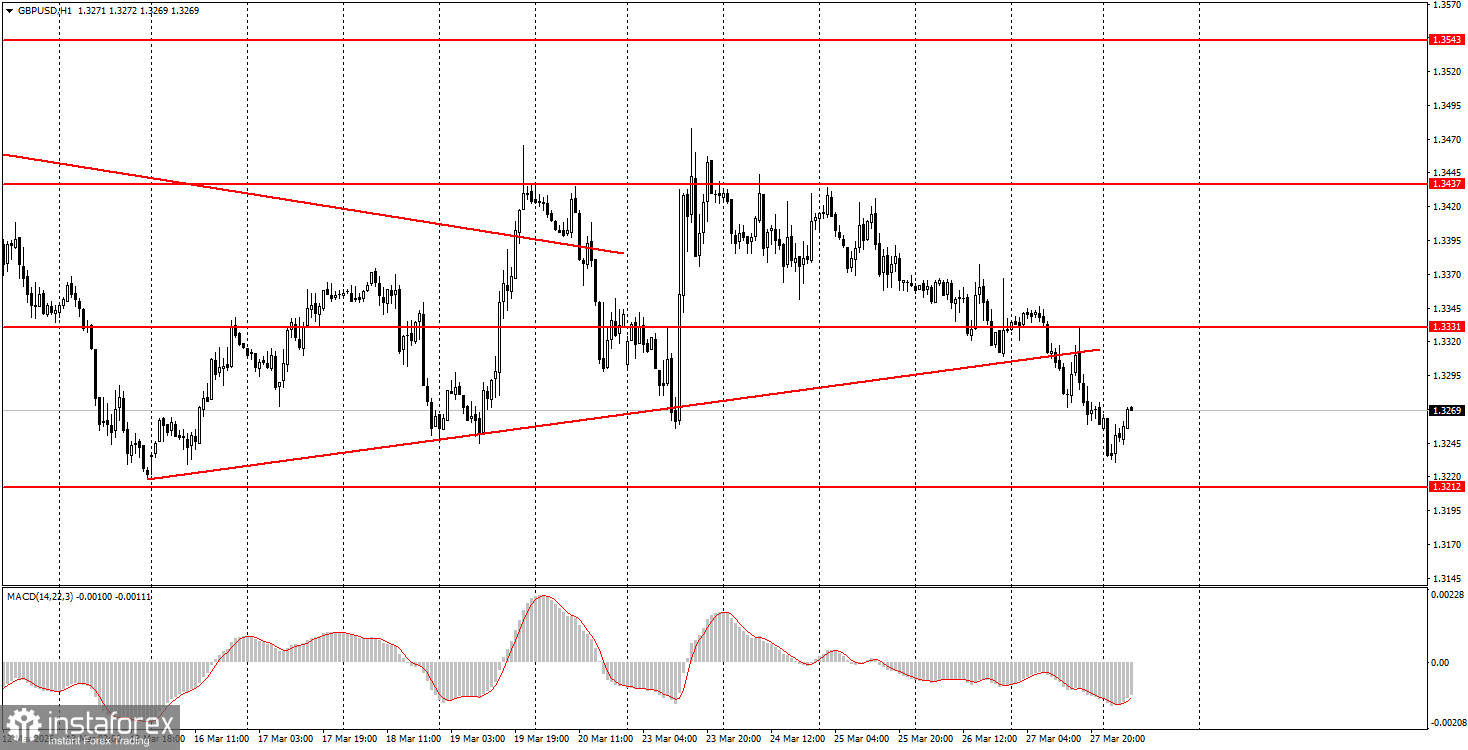
1H Chart of the GBP/USD Pair
The GBP/USD pair continued to move south on Friday, but the decline was much stronger compared to the EUR/USD pair. It can be said that, amid the fuel crisis and complex geopolitical situation in the Middle East, the British currency is feeling more confident and stable. Regardless, the ascending trend line on the hourly timeframe has been broken, so we can now speak of a downward trend once again. Traders did not believe Donald Trump last week, so the dollar is rising. This week, a ground military operation could begin in the Middle East, as many experts are currently pointing to Kharg Island, through which almost all Iranian oil exports pass. Therefore, capturing this island would not only paralyze oil exports from Iran but would also block Tehran's financial ability to resist the US. In our view, everything points to an expansion of the conflict in the Middle East, which may provoke a new rise in the US currency regardless of this week's macroeconomic data.
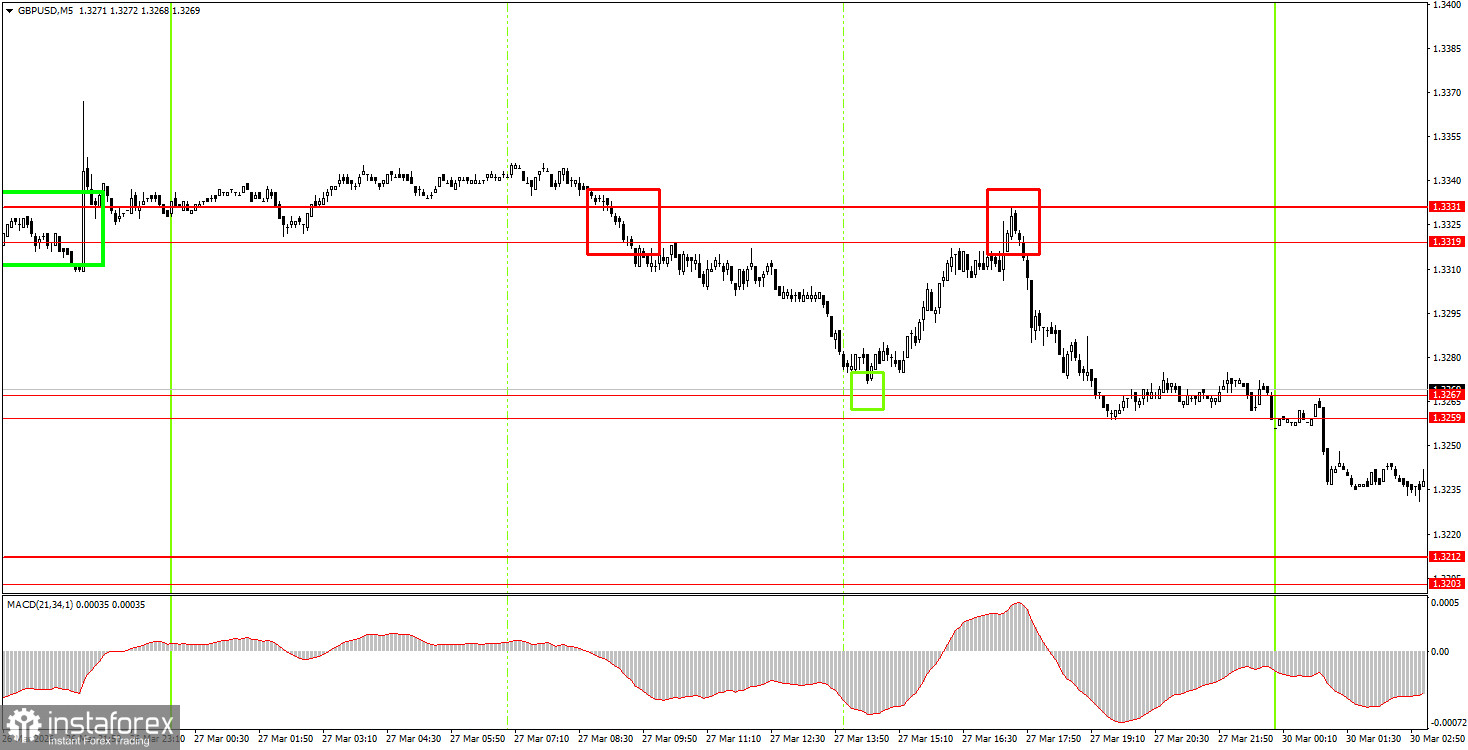
5M Chart of the GBP/USD Pair
On the 5-minute timeframe, three fairly good trading signals were formed on Friday, and the movements of the British pound showed more interesting and volatile behavior. Initially, beginner traders could open short positions from the area of 1.3319-1.3331, then long positions from the area of 1.3259-1.3267, and then again short positions from the area of 1.3319-1.3331. In all three cases, the nearest target area was reached. Consequently, all three trades turned out to be profitable.
How to Trade on Monday:
On the hourly timeframe, the GBP/USD pair's latest upward trend was broken last Friday. There are no global grounds for medium-term dollar growth, so in 2026, we expect the continuation of the global upward trend from 2025. However, this requires geopolitical tensions worldwide to start decreasing, because at present, the dollar is in demand solely on geopolitical grounds.
On Monday, beginner traders may consider opening short positions if the price consolidates below the 1.3259-1.3267 range, targeting 1.3203-1.3212. A consolidation above the 1.3259-1.3267 area will allow for long positions with a target of 1.3319-1.3331.
On the 5-minute timeframe, trading levels to consider include 1.3096-1.3107, 1.3203-1.3212, 1.3259-1.3267, 1.3319-1.3331, 1.3403-1.3407, 1.3437-1.3446, 1.3484-1.3489, 1.3529-1.3543, 1.3643-1.3652, and 1.3695-1.3741-1.3751. Today, there are no important events or reports scheduled in the UK or the US. Therefore, unless there are any news updates from Trump or Iran, we can expect a boring Monday.
Key Principles of the Trading System:
- The strength of a signal is determined by the time it takes to form the signal (bounce or breakout). The less time taken, the stronger the signal.
- If two or more trades have been opened at a particular level based on false signals, all subsequent signals from that level should be ignored.
- In a flat market, any pair can form many false signals or none at all. In any case, at the first signs of a flat trend, it is best to stop trading.
- Trading deals are to be opened during the period between the start of the European session and the mid-American session, after which all trades should be closed manually.
- On the hourly timeframe, it is preferable to trade based on signals from the MACD indicator only when there is good volatility and a trend confirmed by a trend line or trend channel.
- If two levels are positioned too close together (5-20 pips apart), they should be considered a support or resistance area.
- Upon moving 20 pips in the correct direction, a Stop Loss should be set to breakeven.
What to Look for on the Charts:
Price levels of support and resistance are levels that serve as targets when opening buys or sells. Take Profit levels can be placed around them.
Red lines represent channels or trend lines that show the current trend and indicate the direction in which it is preferable to trade now.
The MACD indicator (14,22,3) – the histogram and the signal line – is a supporting indicator that can also be used as a source of signals.
Important speeches and reports (always included in the news calendar) can significantly affect the movement of the currency pair. Therefore, during their release, trading should be done with utmost caution, or traders should exit the market to avoid sharp price reversals against the previous movement.
Beginning traders in the forex market should remember that not every trade can be profitable. Developing a clear strategy and effective money management are the keys to long-term trading success.