empty
 
 
25.06.2024 12:01 PM
EUR/USD. June 25th. We continue to rest and adjust

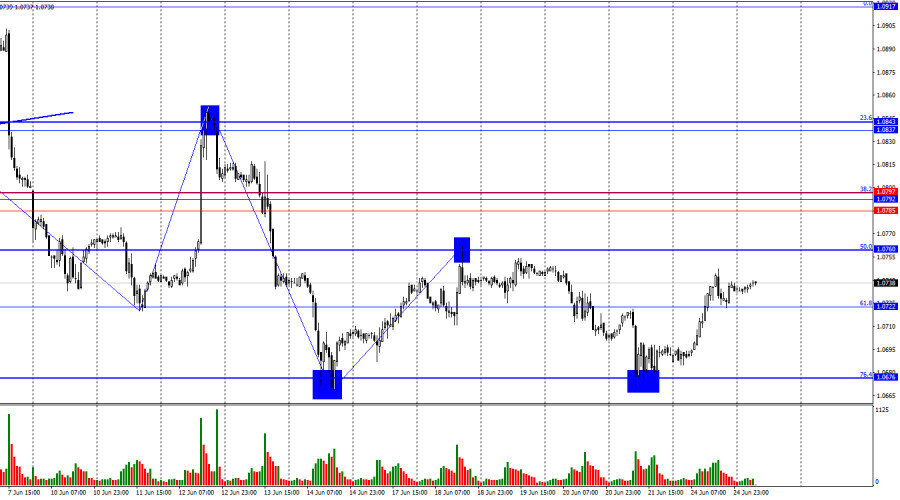
On Monday, the EUR/USD pair continued to rise after the second rebound from the corrective level of 76.4%-1.0676. The pair consolidated above the Fibonacci level of 61.8%-1.0722, which suggests further growth towards the next corrective level of 50.0%-1.0760. A rebound from this level will favor the US dollar and initiate a decline towards 1.0722. Consolidation above the 1.0760 level will increase the likelihood of continued growth towards the resistance zone of 1.0785–1.0797.

This image is no longer relevant

The wave situation remains clear. The last completed upward wave was very weak and failed to break the peak of the previous wave. The last downward wave (which may still need to be completed) failed to break the low of the previous wave. Thus, the "bearish" trend persists, but the first sign of a trend change to "bullish" could appear soon. This sign would be breaking the peak of the last upward wave from June 18th. If this does not happen, I expect a return to the 1.0676 level.

The news background on Monday was extremely weak, but the bulls used this day to their advantage. Since the bears had no "fuel" for new sales, they took a pause, which the bulls capitalized on. This week, the bulls will generally have better conditions for work, as the news background is mostly weak or absent. Therefore, I expect the pair to continue rising to the 1.0760 level. From this level, a rebound is highly likely, but the price may also "prick" the last peak. After this, the decline may resume, confirming the price's presence in a horizontal corridor. The target will again be the 1.0676 level. In the slightly longer term, I expect the European currency to resume its decline, as I believe the factor of the beginning of monetary policy easing in the Eurozone will be substantial support for the bears.

This image is no longer relevant

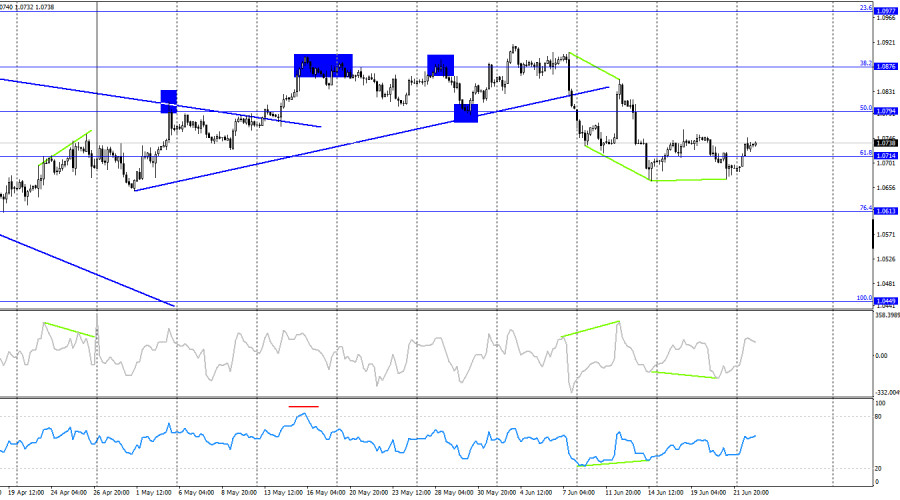
On the 4-hour chart, the pair performed a new reversal in favor of the euro after forming a "bullish" divergence on the CCI indicator. The quotes returned to the 61.8% Fibonacci level at 1.0714, but I still do not believe in prolonged euro growth. On the 4-hour chart, a week ago, there was a closing below the trend line, which changed traders' sentiment to "bearish." Thus, I expect a minor (in strength) correction, followed by a resumption of the "bearish" trend. I recommend using levels from the hourly chart now.

Commitments of Traders (COT) report:

This image is no longer relevant

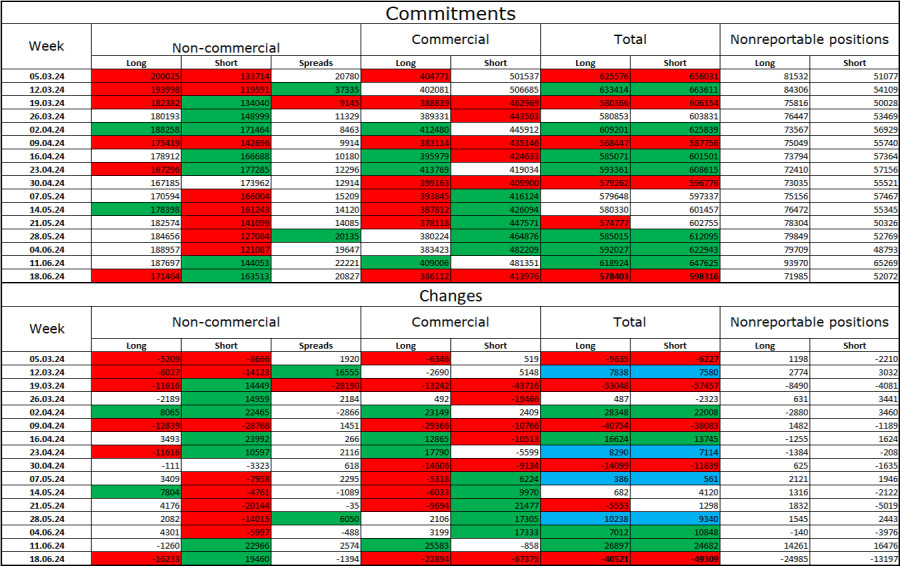
During the last reporting week, speculators closed 16,233 long positions and opened 19,460 short positions. The sentiment of the "Non-commercial" group turned "bearish" a few weeks ago and is currently only getting stronger. The total number of long positions held by speculators is now 171,000, while the number of short positions is 163,000. The gap continues to narrow.

The situation will continue to change in favor of the bears. I do not see long-term reasons to buy the euro, as the ECB has begun easing monetary policy, which will reduce the yield on bank deposits and government bonds. In the US, they will remain at a high level for several more months at least, making the dollar more attractive to investors. The potential for the euro to decline is significant, even according to the COT reports. If there is still a bullish sentiment among major players and the euro is falling, where will the euro be when the sentiment turns bearish?

News Calendar for the US and Eurozone:

On June 25th, the economic events calendar contains only one minor entry. The impact of the news background on trader sentiment today will be absent.

Forecast for EUR/USD and Trader Tips:

Sales of the pair were possible upon a rebound from the 1.0760 level on the hourly chart, with targets of 1.0676 and 1.0602. The first target was reached, and a rebound from it suggested closing deals. New sales can be made upon a rebound from the 1.0760 level with targets of 1.0722 and 1.0676. Buying the euro was possible upon a rebound on the hourly chart from the 1.0676 level with targets of 1.0722 and 1.0760. These trades can be kept open.

The Fibonacci levels are drawn from 1.0602 to 1.0917 on the hourly chart and from 1.0450 to 1.1139 on the 4-hour chart.

Samir Klishi,
انسٹافاریکس کا تجزیاتی ماہر
© 2007-2024
انسٹافاریکس کے ساتھ کرپٹو کرنسی کی معاملاتی تبدیلیوں سے کمائیں۔
میٹا ٹریڈر 4 ڈاؤن لوڈ کریں اور اپنی پہلی ٹریڈ کھولیں۔
  • Grand Choice
    Contest by
    InstaForex
    InstaForex always strives to help you
    fulfill your biggest dreams.
    مقابلہ میں شامل ہوں
  • چانسی ڈیپازٹ
    اپنے اکاؤنٹ میں 3000 ڈالر جمع کروائیں اور حاصل کریں$4000 مزید!
    ہم جولائی قرعہ اندازی کرتے ہیں $4000چانسی ڈیپازٹ نامی مقابلہ کے تحت
    اپنے اکاؤنٹ میں 3000 ڈالر جمع کروانے پر موقع حاصل کریں - اس شرط پر پورا اُترتے ہوئے اس مقابلہ میں شرکت کریں
    مقابلہ میں شامل ہوں
  • ٹریڈ وائز، ون ڈیوائس
    کم از کم 500 ڈالر کے ساتھ اپنے اکاؤنٹ کو ٹاپ اپ کریں، مقابلے کے لیے سائن اپ کریں، اور موبائل ڈیوائسز جیتنے کا موقع حاصل کریں۔
    مقابلہ میں شامل ہوں
  • 100 فیصد بونس
    اپنے ڈپازٹ پر 100 فیصد بونس حاصل کرنے کا آپ کا منفرد موقع
    بونس حاصل کریں
  • 55 فیصد بونس
    اپنے ہر ڈپازٹ پر 55 فیصد بونس کے لیے درخواست دیں
    بونس حاصل کریں
  • 30 فیصد بونس
    ہر بار جب آپ اپنا اکاؤنٹ ٹاپ اپ کریں تو 30 فیصد بونس حاصل کریں
    بونس حاصل کریں

تجویز کردہ مضامین

ابھی فوری بات نہیں کرسکتے ؟
اپنا سوال پوچھیں بذریعہ چیٹ.
Widget callback