Short trem :
Our strategy of analysis today:
Trend - breakout down. Downtrend :
Reversal of trend after confirmation of breakout. EUR/USD pair : If the pair fails to pass through the level of 1.1055, the market will indicate a bearish opportunity below the strong resistance level of 1.1055. In this regard, sell deals are recommended lower than the 1.1055 level with the first target at 1.0954. It is possible that the pair will turn downwards continuing the development of the bearish trend to the level 1.0910. Third objective will be located at 1.0900.
Review
The weekly pivot sets at the point of 1.1003 and the trend is still moving above it. The EUR/USD pair dropped from the level of 1.1076 to the bottom around 1.0910. But the pair has rebounded from the bottom of 1.0910 to close at 1.0950. Today, the first support level is seen at 1.0910, and the price is moving in a bearish channel now.
Furthermore, the price has been set below the strong resistance at the level of 1.1013, which coincides with the 61.8% Fibonacci retracement level. On the one-hour chart, the current rise will remain within a framework of correction.
However, if the pair fails to pass through the level of 1.1076 (major resistance), the market will indicate a bearish opportunity below the strong resistance level of 1.1013. This resistance (1.1013) has been rejected several times confirming the downtrend.
The US dollar's strong gains against the Euro have continued today ahead of the sturdy news. The common currency reached a high of more than three week earlier this morning. This technical analysis of EURUSD looks at the one-hour chart. The highest price that EUR/USD reached for that period was 1.1076 (last bullish wave - top). The lowest price that the EUR/USD pair reached during that period was 1.1023 (right now).
Thus, the EUR/USD pair settled below 1.0950 and is testing the support level at 1.0910. RSI and Moving averages continue to give a very strong sell signal with all of the 50 and 100 EMAs successively above slower lines and below the price. The 50 EMA has extended further below the 100 this week. Support from MAs comes initially from the value zone between the 50 and 100 EMAs. Industriously, Euro Is Losing ground against U.S. Dollar around -85 pips.
Additionally, the RSI starts signaling a downward trend. As a result, if the EUR/USD pair is able to break out the first support at 1.0910, the market will decline further to 1.0850 in order to test the weekly support 2. In the H1 time frame, the pair will probably go down because the downtrend is still strong. Consequently, the market is likely to show signs of a bearish trend. Since there is nothing new in this market, it is not bullish yet. So, it will be good to sell below the level of 1.1013 with the first target at 1.0910 and further to 1.0850. At the same time, the breakdown of 1.0500 will allow the pair to go further up to the levels of 1.1013 in order to retest the weekly top.
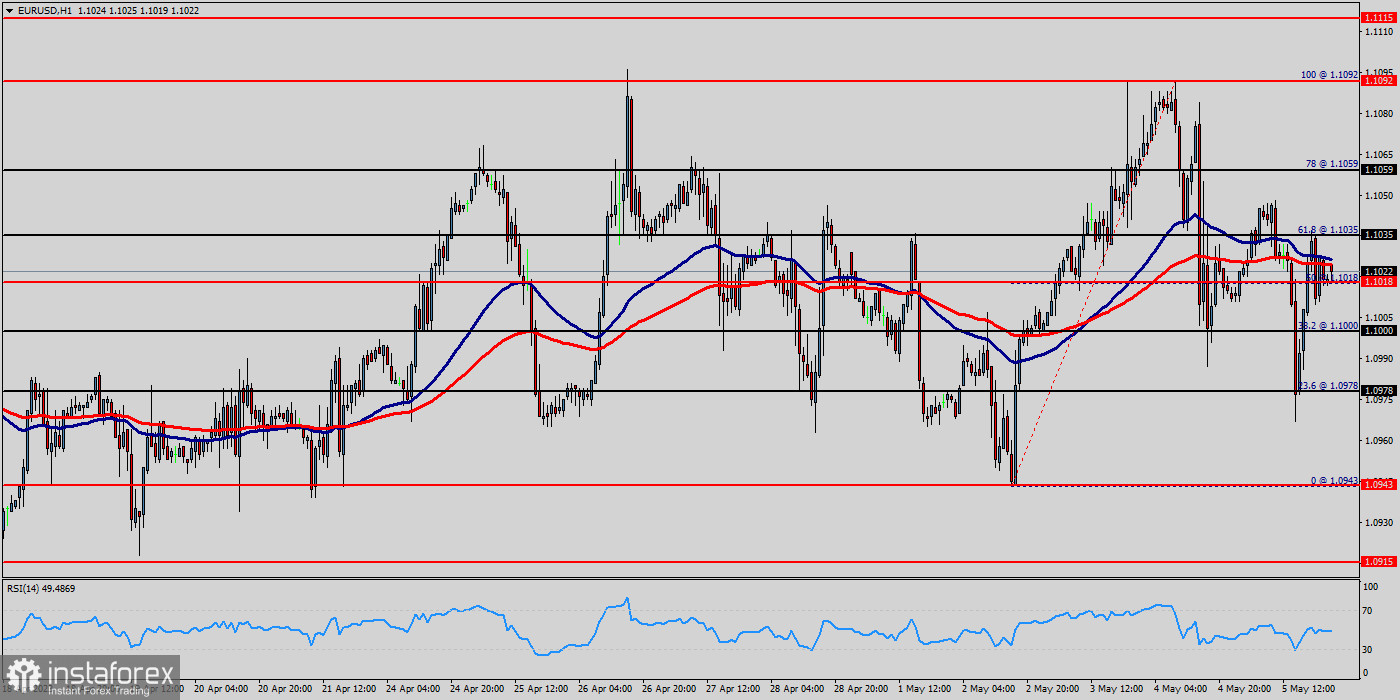
Euro parity still in play ahead of decisive US inflation data, for that common currency came within whisker of 1.1018 this week. Right now, the EUR/USD pair is still moving around the price of 1.1018. The currency pair EUR/USD is trading below the resistance levels of 1.1052 and 1.1092. The euro to US dollar (EUR/USD) rate has risen about 0.25% month-to-date to trade around 1.1018. The raise is comparable to gain last seen for three weeks, when the European Central Bank unleashed its massive stimulus programme.
The EUR/USD pair continues to move upwards from the level of 1.1018, which represents the double bottom in the hourly chart. The pair rose from the level of 1.0970 to the top around 1.1018 USD. Today, the first resistance level is seen at 1.1052 followed by 1.1092 and 1.1115, while daily support is seen at the levels of 1.0943 and 1.015. According to the previous events, the EUR/USD pair is still trading between the levels of 1.0943 and 1.1092. Hence, we expect a range of 149 pips in coming hours (1.1092 - 1.0943).
The first resistance stands at the price of 1.0927, therefore if the EUR/USD pair succeeds to break through the resistance level of 1.1092, the market will rise further to 1.1115. This would suggest a bullish market because the RSI indicator is still in a positive area and does not show any trend-reversal signs. The pair is expected to rise higher towards at least 1.1092 in order to test the second resistance (1.1115). The US Dollar and the Euro are two of the most prominent and well-known currencies in the world. The Euro versus US Dollar (EUR/USD) currency pair has the largest global trading volume, meaning it is the world's most-traded currency pair. Whether you find the instrument easy or difficult to trade on, it's not a pair that many traders neglect, due to its daily volatility and price movement.
The market is indicating a bearish opportunity above the above-mentioned support levels, for that the bullish outlook remains the same as long as the 100 EMA is headed to the upside. Today, support is seen at the levels of 1.0943 and 1.0915. So, we expect the price to set above the strong support at the levels of 1.0943 and 1.0915; because the price is in a bullish channel now.
The RSI starts signaling upward trend. Consequently, the market is likely to show signs of a bullish trend. It will be good to buy above the level of 1.1018 with the first target at 1.1092 and further to 1.1115 in order to test the daily resistance. If the EUR/USD pair is able to break out the daily resistance at 1.1055, the market will rise further to 1.1115 to approach support 3 in coming hours or two days. However, the price spot of 1.1115 and 1.1092 remains a significant resistance zone. Therefore, the trend is still bullish as long as the level of 1.0915 is not breached.