To open long positions on EUR/USD, you need:
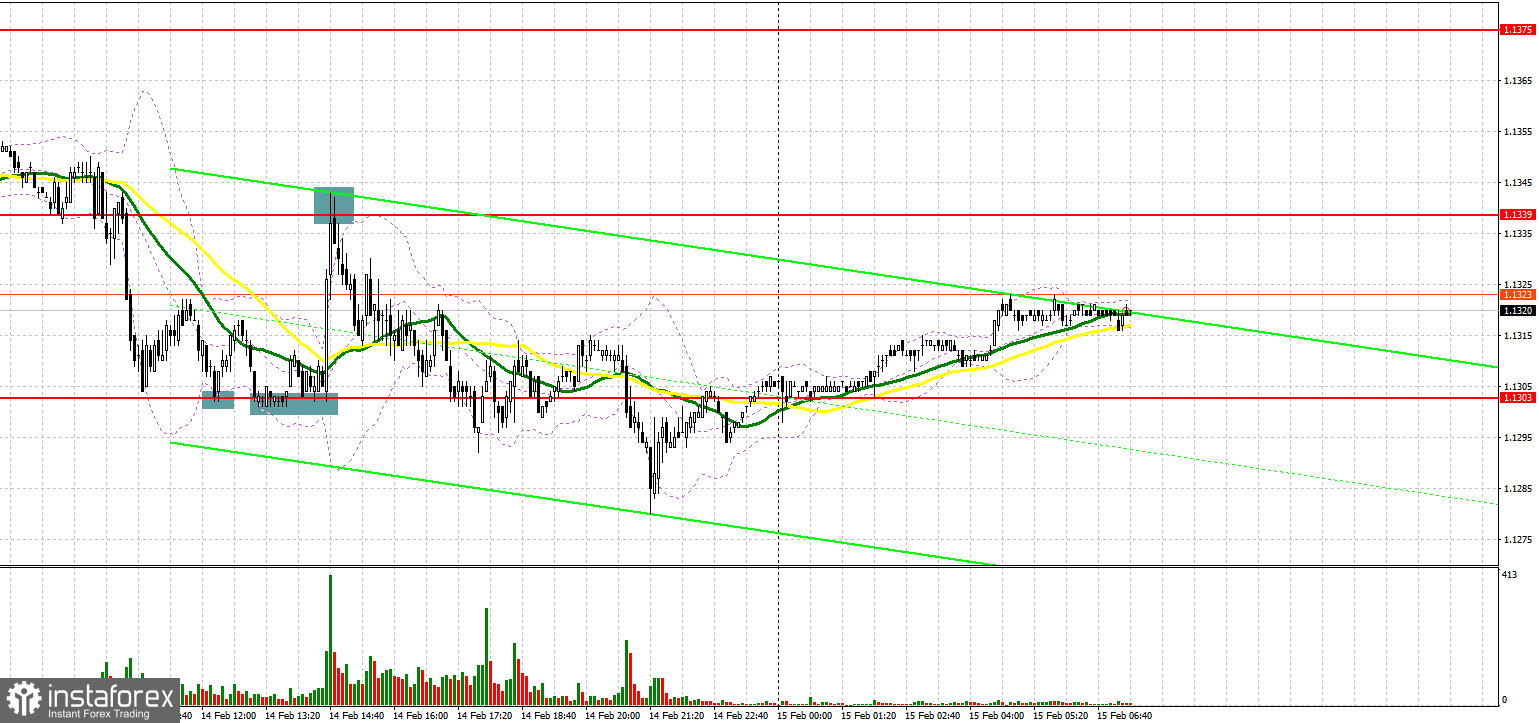
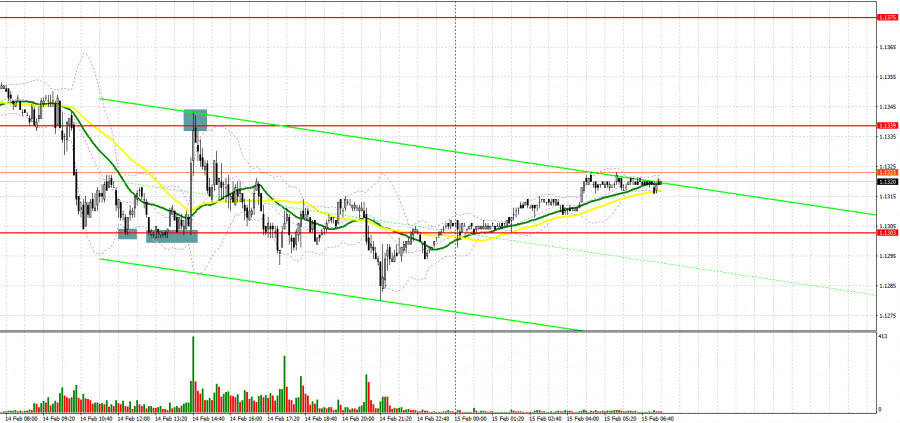
Yesterday, quite a lot of signals were formed to enter the market. Let's look at the 5-minute chart and figure out what happened. In my morning forecast, I paid attention to several levels of support. Forming a false breakout at 1.1333 resulted in creating a good signal to buy the euro, however, after the pair rose 10 points, the pressure on the trading instrument returned. The bears achieved a breakthrough of 1.1333, but it did not reach the reverse test of this level – there was no sell signal. Under such circumstances, we had to wait for the 1.1303 test, and it happened. Another false breakout and a buy signal. However, the first upward movement was about 20 points. Then several more good entry points into long positions were formed from this level, after which the pair still shot up, demonstrating a return to the 1.1339 area. A false breakout at this level and a sell signal - all this led to the fall of the euro in the afternoon in anticipation of the results of the Federal Reserve meeting, which no one has waited for.
Before we talk about the future prospects of the EUR/USD movement, let's look at what happened in the futures market and how the positions of Commitment of Traders have changed. The Commitment of Traders (COT) report for February 8 recorded the growth of long positions and the reduction of short ones. This report already takes into account the European Central Bank meeting, at which its president Christine Lagarde made it clear to all market participants that the central bank will act more aggressively if the observed picture with inflation does not change, or changes for the worse. Last week, officials from the ECB took a wait-and-see attitude, and a technical reversal of the bull market led to a decline in the EUR/USD pair. Demand for risky assets has also decreased due to the risk of a military conflict between Russia and Ukraine. However, a more weighty argument for the observed downward movement of the EUR/USD pair is the Federal Reserve's actions in relation to interest rates. An extraordinary meeting was held on Monday, February 14, the results of which were preferred to be hidden from the public – this is even more adding fuel to the fire that is flaring up around high inflationary pressure in the United States. Some economists expect that the central bank may resort to more aggressive actions and raise rates immediately by 0.5% in March this year, rather than by 0.25%, as originally planned. This is a kind of bullish signal for the US dollar. The COT report indicates that long non-commercial positions increased from the level of 213,563 to the level of 218,973, while short non-commercial positions decreased from the level of 183,847 to the level of 180,131. This suggests that traders continue to build up long positions with every good decline in the European currency. At the end of the week, the total non-commercial net position increased slightly and amounted to 38,842 against 29,716. The weekly closing price jumped and amounted to 1.1441 against 1.1229 a week earlier.
As I noted above, the results of the Fed meeting were hidden from the public, which makes the meeting more mysterious than before. It is not entirely clear as to what happened when the committee announced an unscheduled meeting and then decided to hide its results. Obviously, it was not possible to reach any consensus on interest rates. Today there is a fairly large volume of statistics on the eurozone countries, which may affect the direction of the EUR/USD pair, so I recommend focusing on these reports in the first half of the day. So far, the optimal scenario for opening long positions is a decline to the area of 1.1305 in the first half, and forming a false breakout at this level, by analogy with what I analyzed above, as well as good data on the index of sentiment in the business environment of Germany and the eurozone, and a more active change in the volume of eurozone GDP - all this will lead to forming a signal to open long positions based on an upward correction in the morning. But, in addition to a false breakout, an active upward movement is also necessary. If the bulls will not be able to offer anything when 1.1305 is tested, it is better not to rush with long positions. A breakthrough of this level may lead to a larger sell-off. In this case, I advise buying EUR/ USD only after updating the next support 1.1269. However, I advise you to enter the market only if a false breakout is formed.
You can immediately open long positions for a rebound from the low of 1.1235, or even lower - around 1.1200, counting on an upward correction of 15-20 points within the day. An equally important task is to regain control of the 1.1340 level, which they failed to do yesterday afternoon. There are moving averages that play on the bears' side, so it will not be so easy to go higher. A breakthrough and consolidation above this range, together with good data on the eurozone, will certainly increase the appetite for risks, which creates an excellent entry point for long positions in order to go back to the area of yesterday's highs (1.1375). Going beyond this range will return the bull market and lead to an update of the levels: 1.1407 and 1.1452, where I recommend taking profits.
To open short positions on EUR/USD, you need:
Bears keep the market under their control, there are fewer and fewer people willing to sell at current lows, as even the belated COT report clearly tells us. The optimal scenario for opening short positions in the first half of the day is when a false breakout forms at the level of 1.1340, there are also moving averages playing on the bears' side. This creates an excellent entry point into short positions with the prospect of a further decline in EUR/USD to the intermediate level of 1.1305. Weak data on the eurozone countries, together with a breakdown and a reverse test from the bottom up of this range, will create another signal to enter the market, which will push the pair to a low of 1.1269 and open a direct road to 1.1235. A more distant goal will be the 1.1200 area, where I recommend taking profits. A test of this level will only strengthen the new bearish trend in the euro. If the pair recovers during the European session and bears are inactive at 1.1340, the optimal scenario will be selling when a false breakout is formed in the 1.1375 area. It is possible to open short positions on EUR/USD immediately for a rebound from the highs: 1.1407 and 1.1452 with the goal of a downward correction of 15-20 points.
Indicator signals:
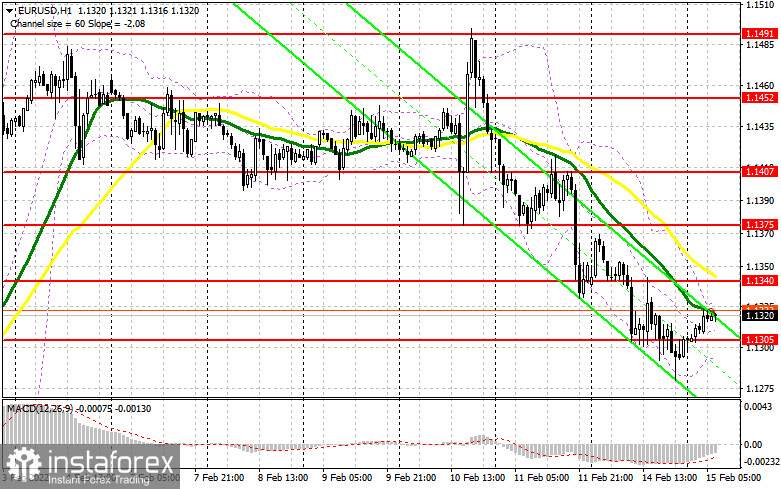
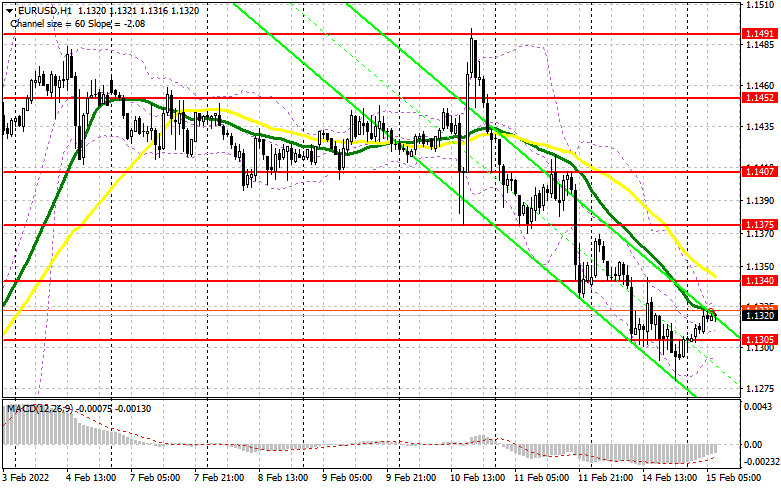
Trading is conducted below the 30 and 50 moving averages, which indicates the continuation of the bear market.
Moving averages
Note: The period and prices of moving averages are considered by the author on the H1 hourly chart and differs from the general definition of the classic daily moving averages on the daily D1 chart.
Bollinger Bands
A breakthrough of the upper limit of the indicator in the area of 1.1325 will lead to an increase in the euro. A breakthrough of the lower limit of the indicator in the area of 1.1295 will increase the pressure of the pair.
Description of indicators
- Moving average (moving average, determines the current trend by smoothing out volatility and noise). Period 50. It is marked in yellow on the chart.
- Moving average (moving average, determines the current trend by smoothing out volatility and noise). Period 30. It is marked in green on the chart.
- MACD indicator (Moving Average Convergence/Divergence — convergence/divergence of moving averages) Quick EMA period 12. Slow EMA period to 26. SMA period 9
- Bollinger Bands (Bollinger Bands). Period 20
- Non-commercial speculative traders, such as individual traders, hedge funds, and large institutions that use the futures market for speculative purposes and meet certain requirements.
- Long non-commercial positions represent the total long open position of non-commercial traders.
- Short non-commercial positions represent the total short open position of non-commercial traders.
- Total non-commercial net position is the difference between short and long positions of non-commercial traders.