To open long positions on GBP/USD, you need:
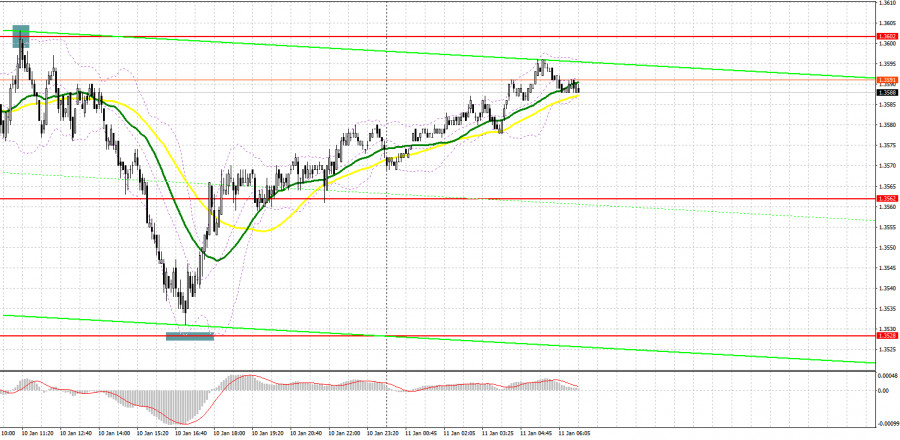
Yesterday only one signal was formed to enter the market in the second half of the day. Let's take a look at the 5 minute chart and understand the entry points. In my morning forecast, I paid attention to the 1.3602 level and advised you to make decisions on entering the market. Bulls' attempt to settle at new highs were unsuccessful. The formation of a false breakout at the level of 1.3602 resulted in forming a signal to sell the British pound, after which the pair fell to the level of 1.3562, and then broke it, which led to a larger movement to the 1.3528 area - more than 70 points in total. However, literally a few points were missing before the 1.3528 test, therefore, it was not possible to get entry points into long positions from there. As of today, the technical picture has not changed in any way.
Before analyzing the technical picture of the pound, let's look at what happened in the futures market. The Commitment of Traders (COT) report for January 4 revealed a sharp increase in long positions and a reduction in short positions - which indicates an increase in the pound's appeal after the Bank of England raised interest rates at the end of last year. If you look at the overall picture, the prospects for the British pound look pretty good. The BoE's decisions continue to support buyers of risky assets in the expectation that the central bank will continue to raise interest rates this year, which will make the pound even more attractive. High inflation remains the main reason why the BoE will continue to tighten monetary policy. On the other hand, the US dollar also has support: inflation data in the US are expected this week, which, together with the recent report on the US labor market, will certainly force the Federal Reserve to act more aggressively. The first interest rate hikes are planned in the spring, which will make the US dollar more attractive. The COT report for January 4 indicated that long non-commercial positions rose 20,824 to the level of 25,980, while short non-commercial positions fell from the level of 78,510 to the level of 65,151. This led to a serious change in the negative non-commercial net position from -57,686 to -39,171. The weekly closing price rose from 1.3209 to 1.3482.

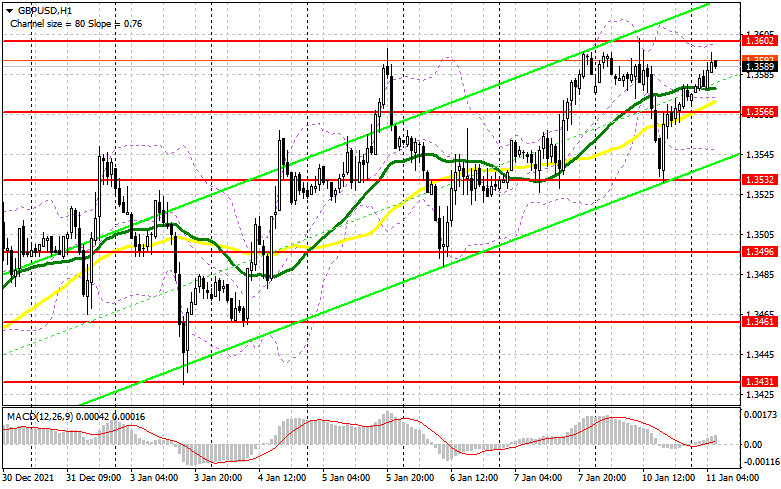
Today, we again do not have important fundamental statistics for the UK, which could somehow affect the pound's direction. Most likely, during the European session, trade will remain within the horizontal channel with the prospect of further growth for the pound according to the trend formed in early December of this year. Larger movements are expected only during the US session, when representatives of the US central bank together with Fed Chairman Jerome Powell will speak. The bulls' primary task for today is to protect the support of 1.3566. This level is very important, as its breakdown can force traders to take profits from the January highs, which will lead to the formation of pressure on the pound and its major fall. Forming a false breakout at 1.3566 will give a signal to buy GBP/USD with the prospect of a continuation of the bull market aimed at a repeated breakthrough of the resistance of 1.3602, above which it is still not possible to get out. A breakthrough and test of this level from top to bottom will give an additional entry point and strengthen the bulls' position in order to continue the pair's growth and update the highs: 1.3649 and 1.3694. The 1.3754 level is a more distant target, where I recommend taking profits. In case the pound falls during the European session and a lack of activity at 1.3566, it is best to postpone long positions to the level of 1.3532 - as we saw yesterday, there is a large static buyer in this area. Forming a false breakout there will provide an entry point in hopes of maintaining bullish momentum. You can buy GBP/USD immediately on a rebound from 1.3496, or even lower - from a low like 1.3461, counting on a correction of 20-25 points within a day.
To open short positions on GBP/USD, you need:
The bears managed to recapture the 1.3602 level yesterday, returning trading to the channel. After that, another downward correction took place, which was only an excuse for building up long positions on the part of major players. The bears' primary task is to protect the 1.3602 range. Forming a false breakout at this level, by analogy with yesterday, creates the first entry point into short positions, followed by a decline to the area of 1.3566, just above which the moving averages are playing on the bulls' side. We will have to fight hard for this level, as the bulls clearly do not intend to let go of the upward trend. A breakdown of 1.3566 will lead to the demolition of a number of bulls' stop orders, and a reverse test from the bottom up will increase pressure on the pound and dump it to the next support of 1.3532, where, as I noted above, there is a large bull counting on new figures. Only the consolidation and the reverse test of 1.3532 from the bottom up will give a new entry point into short positions with the prospect of a decline in GBP/USD by 1.3496 and 1.3461, where I recommend taking profits. If the pair grows during the European session and bears are weak at 1.3602, it is best to postpone short positions to a larger resistance of 1.3649. I also advise you to open short positions there only in case of a false breakout. It is possible to sell GBP/USD immediately for a rebound from the 1.3694 high, or even higher - from the area of 1.3754, counting on the pair's rebound down by 20-25 points within the day.

Indicator signals:
Trading is conducted above the 30 and 50 moving averages, which indicates continued growth of the pound in the short term.
Moving averages
Note: The period and prices of moving averages are considered by the author on the H1 hourly chart and differs from the general definition of the classic daily moving averages on the daily D1 chart.
Bollinger Bands
A breakthrough of the lower border of the indicator in the area of 1.3540 will increase the pressure on the pair. A breakout of the upper border in the 1.3605 area will lead to a new wave of growth in the pound.
Description of indicators
- Moving average (moving average, determines the current trend by smoothing out volatility and noise). Period 50. It is marked in yellow on the chart.
- Moving average (moving average, determines the current trend by smoothing out volatility and noise). Period 30. It is marked in green on the chart.
- MACD indicator (Moving Average Convergence/Divergence — convergence/divergence of moving averages) Quick EMA period 12. Slow EMA period to 26. SMA period 9
- Bollinger Bands (Bollinger Bands). Period 20
- Non-commercial speculative traders, such as individual traders, hedge funds, and large institutions that use the futures market for speculative purposes and meet certain requirements.
- Long non-commercial positions represent the total long open position of non-commercial traders.
- Short non-commercial positions represent the total short open position of non-commercial traders.
- Total non-commercial net position is the difference between short and long positions of non-commercial traders.


