What is needed to open long positions on GBP/USD
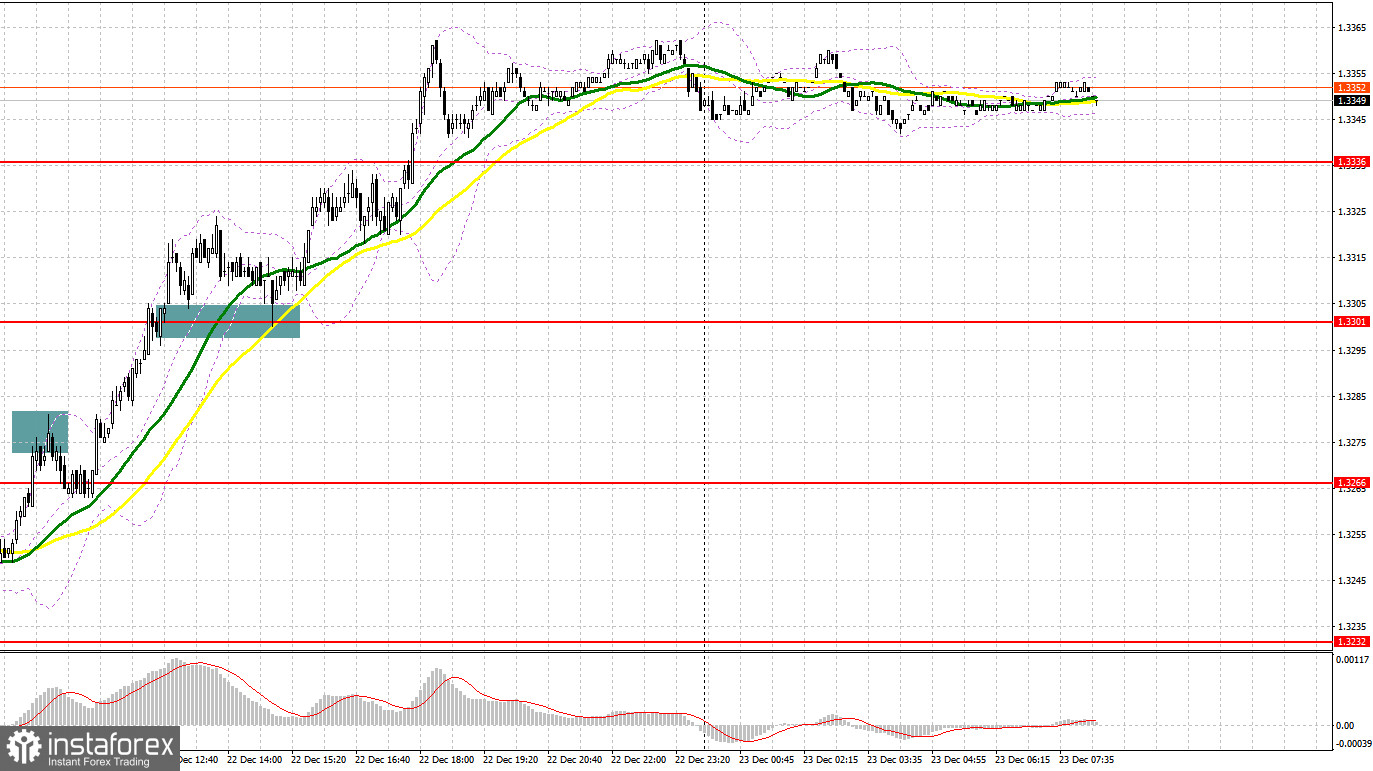
Yesterday, GBP/USD sent a few signals for the market entry. Let's look at the 5-minute chart to figure out market entry points. I turned your attention to the level of 1.3271 and recommended we decide on the market entry with this level in view. A failed breakout and a drop to 1.3271 as well as weaker-than-expected UK GDP data for Q3 2021 ... What could be better for a sell signal? In practice, it often happens that the market decides to move on its own. As a result, traders had to fix losses. After the second breakout of 1.3271, GBP/USD clicked into gear. I didn't see the opposite test of 1.3271, so I had to miss the entry point. In the second half of the trading day, we watched 1.3301 broken and the price settled above it. The opposite test of this level downwards generated a good signal for opening long positions on GBP/USD. Later on, the uptrend was in progress. As a result, we could have gained a 60-pips profit.
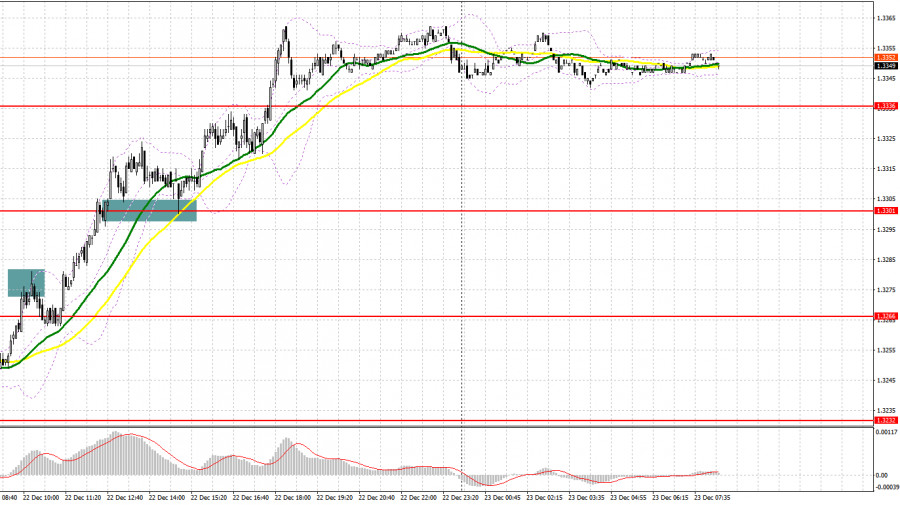
Today, the economic calendar for the UK is empty. So, the market buzz will happen in the second half of the day. Apparently, the bulls will challenge resistance of 1.3372 in the European session. Thus, traders will focus on this level. The major task for the sterling bulls is to defend support of 1.3331. Only a fake breakout in this area will give a nice signal to buy GBP betting on its strength. The bullish market could break resistance at 1.3372. A breakout and a test of this level downwards will create an extra entry point and reinforce buying pressure, thus opening the door to the bullish trend. The pair will be able to update highs of 1.3407 and 1.3446. A test of 1.3407 downwards will give another entry point to buy GBP/USD with the target of 1.3446 where I recommend profit taking.
Under the bearish scenario of GBP/USD during the European session and the lack of activity at 1.3331, it would be better to cancel buying until 1.3301. This is the level where moving averages are crossing, benefitting the buyers. Only a fake breakout there will signal the entry point in view of a further bullish trend. It is possible to buy GBP/USD immediately at a drop off 1.3266 or lower off 1.3232, bearing in mind a 20-25-pips intraday correction.
What is needed to open short positions on GBP/USD
The bears are not willing to enter the market because it makes no sense for them. Traders are most likely to focus on 1.3372 which is going to be tested in the near time. The sellers should not allow the sterling to climb above 1.3372 because this will trigger stop losses and enable a recovery of GBP/USD with a further bullish trend. A fake breakout at 1.3372 generates the first nice entry point for short positions with a further decline towards 1.3331. The sellers have to fight for this level. If 1.3331 is broken, this will intensify selling pressure and push GBP towards large support of 1.3301. This is the level where moving averages are crossing, benefitting the buyers. It would be a challenge to push the pair below this level. A new entry point will appear only on condition that the pair settles and makes an opposite test of 1.3301 upwards in view of a decline to 1.3266. This price action will invalidate the bullish market that developed yesterday. 1.3266 is the take profit level.
In case GBP/USD grows during the European session and weak selling activity at 1.3372, it would be better to cancel selling until larger resistance of 1.3407. I would recommend opening short positions also after a fake breakout. We could sell GBP/USD immediately at a drop off large resistance at 1.3446 or higher off 1.3472, bearing in mind a 20-25-pips drop intraday.
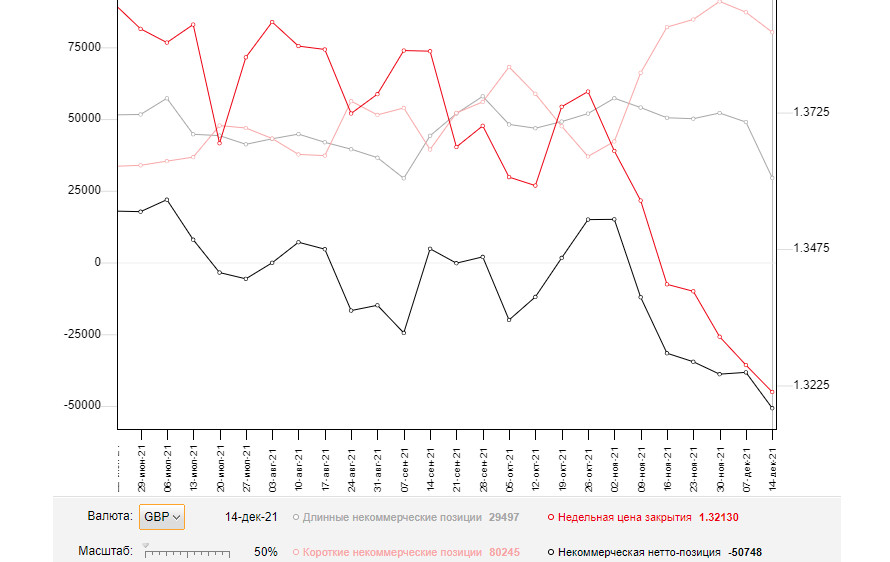
The COT report dated December 14 logs a decrease both in short and long positions. Notably, long positions contracted almost by half that made a serious change in the negative delta. Importantly, this data does not allow for the outcome of the US Fed's and the Bank of England's policy meetings. All in all, the outlook for GBP is rather gloomy. In light of the BoE policy decisions, GBP/USD surged but the pair was hit by massive selling. This situation discourages a lot of market participants who believed that the bearish trend was over. The US dollar seems to enjoy buoyant demand amid uncertainty around the new Omicron virus which is spreading at a rapid pace and scaring off traders. Nobody wants to buy the overbought dollar. At the same time, the weak sterling is also not attractive instrument to buy. The sterling will hardly have bullish prospects until another coronavirus wave recedes. Importantly, high inflation remains the main factor why the Bank of England has embarked on the path of monetary tightening. The regulator is set to raise rates next year that will support the pound sterling. According to the COT from December 14, long non-commercial positions declined to 29,497 from 48,950, whereas short non-commercial positions fell to 80,245 from 87,227. This led to an increase in the negative non-commercial net positions from 38,277 to -50,748. GBP/USD closed last Friday at 1.3213, much lower than 1.3262 a week ago.
Indicator signals:
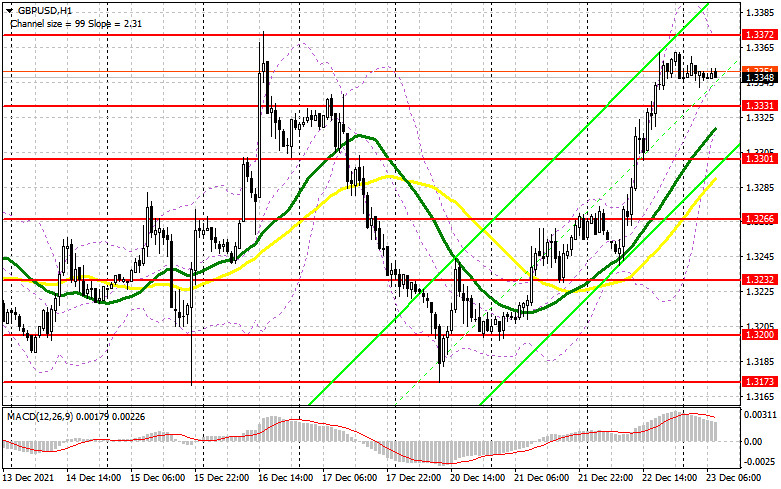
Trading is carried out above the 30 and 50 daily moving averages, which indicates a probable further advance of the sterling.
Moving averages
Note: The period and prices of moving averages are considered by the author on the H1 hourly chart and differs from the general definition of the classic daily moving averages on the daily D1 chart.
Bollinger Bands
A breakout of the indicator's upper border at 1.3372 will trigger a new bullish wave of GBP/USD. Alternatively, if the pair declines, the lower border at near 1.3320 will serve as support.
Description of indicators
- Moving average (moving average, determines the current trend by smoothing out volatility and noise). Period 50. It is marked yellow on the chart.
- Moving average (moving average, determines the current trend by smoothing out volatility and noise). Period 30. It is marked green on the chart.
- MACD indicator (Moving Average Convergence/Divergence — convergence/divergence of moving averages) Quick EMA period 12. Slow EMA period to 26. SMA period 9
- Bollinger Bands (Bollinger Bands). Period 20
- Non-commercial speculative traders, such as individual traders, hedge funds, and large institutions that use the futures market for speculative purposes and meet certain requirements.
- Long non-commercial positions represent the total long open position of non-commercial traders.
- Short non-commercial positions represent the total short open position of non-commercial traders.
- Total non-commercial net position is the difference between short and long positions of non-commercial traders.