To open long positions on GBP/USD, you need:
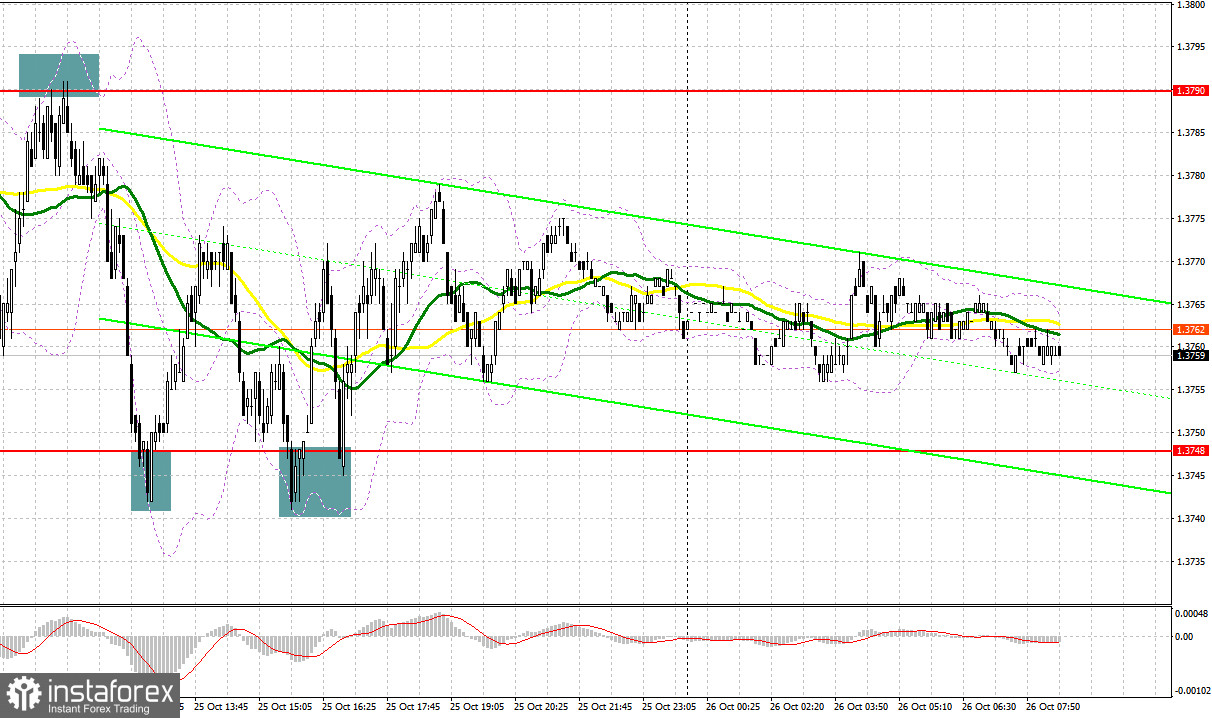
Several good market entry points were formed yesterday. Let's take a look at the 5 minute chart and understand the trades. In the first half of the day, one signal to sell and one signal to buy the British pound was formed. The formation of a false breakout at 1.3790 at the beginning of the European session resulted in an excellent entry point for short positions, which plunged the British pound by 40 points. Then, by analogy with Friday, a false breakout at the level of 1.3748, which I paid attention to in the morning forecast, led to a good entry point into long positions. As a result, the upward movement was about 30 points. In the middle of the US session, after the bulls failed to reach the nearest resistance at 1.3789, a false breakout was formed again in the support area of 1.3748, which gave another entry point to long positions and the pair moved up 30 points within the day.
Before examining the technical picture of the pound, let's take a look at what happened in the futures market. The Commitment of Traders (COT) report for October 19 revealed that short positions decreased while long positions increased, which reflects the upward trend in the pound, observed in the middle of this month. This resulted in the return of the net position of a positive value. Speeches and statements of representatives of the Bank of England claiming that it is necessary to take inflationary pressures more seriously also add to the bulls' confidence. BoE Governor Andrew Bailey's speech last week was well received in the market as he reiterated his stance on changing monetary policy. However, a slight slowdown in monthly and annual inflation growth in the UK limited the pair's upward potential in the middle of the week, which resulted in it being locked in the horizontal channel. I advise you to count on further strengthening of the pound and take advantage of any short-term decline that may occur in case of weak fundamental statistics. The COT report indicated that long non-commercial positions rose from 46,794 to 49,112, while short non-commercials dropped from 58,773 to 47,497. This led to a change in the non-commercial net position from negative to positive. The delta was 1615, against 11,979 a week earlier. The closing price of GBP/USD increased significantly: from 1.3591 to 1.3735.
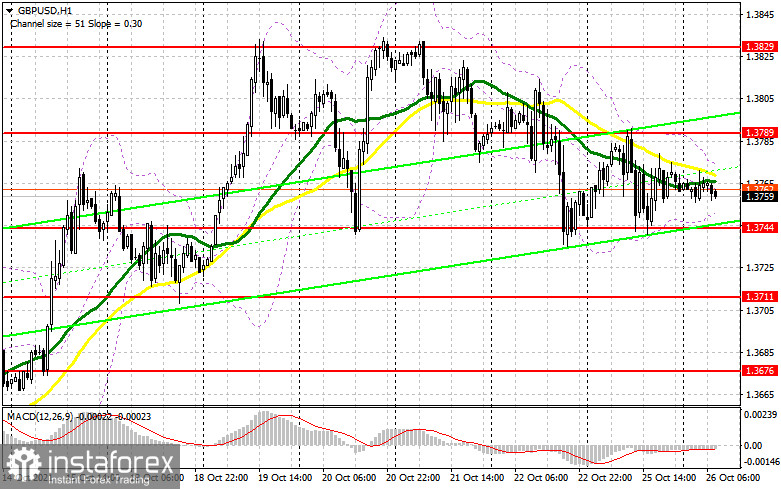
Today, apart from the data on retail sales from the Confederation of British Industry, there are no important fundamental reports, so trading will continue to be carried out in a horizontal channel with a slight advantage for the bears. The bulls need to take control over the resistance at 1.3789 as soon as possible in order to regain control over the market, above which they did not manage to surpass yesterday. Only a breakthrough and reverse test of this range from top to bottom can create a signal to buy GBP/USD, which will resume the upward trend and push the pair even higher - to the area of last week's high of 1.3829. A test of this area will be evidence of the continuation of the bullish trend, however, for greater confidence, you need to settle higher. A breakthrough of 1.3829 will open a direct road to new highs: 1.3864 and 1.3910, where I recommend taking profits. If we see that the pair is under pressure in the first half of the day, I advise you not to rush into long positions. An important task for the bulls is to protect yesterday's support at 1.3744. Only the next formation of a false breakout there, by analogy with what I discussed above, can create a good entry point to buy. Otherwise, the optimal scenario for opening long positions will be the test of support at 1.3711 - it is also best to wait there for a false breakout to form. I advise you to watch long positions of GBP/USD immediately for a rebound only from a low like 1.3676, counting on an upward correction of 25-30 points within the day.
To open short positions on GBP/USD, you need:
The bears showed themselves in the resistance area of 1.3789 yesterday, but this is not enough. Bulls were stronger every time they approached the big support at 1.3748. Today the bears need to think about how to defend 1.3789, as long as trading is carried out below this range, they have a good chance of building a larger downward correction of the pair. There is no need to rely on the fundamental data on the UK today, so only a false breakout in the resistance area of 1.3789 will lead to creating a sell signal, similar to the one I discussed above. The goal is to fall to support at 1.3744. A breakthrough and a reverse test of this level from the bottom up will form a signal to open short positions, counting on the pair's decline to a low like 1.3711, and then a renewal of support at 1.3676, where I recommend taking profits. If the pound rises in the first half and the bears are not active at 1.3789, only the formation of a false breakout in the area of the next resistance at 1.3829 will be a signal to sell GBP/USD. I advise you to open short positions in the pound immediately on a rebound from the high of 1.3864, or even higher - around 1.3910, counting on the pair's rebound down by 20-25 points within the day.
Indicator signals:
Moving averages
Trading is carried out in the area of 30 and 50 moving averages, which indicates an active confrontation between bulls and bears.
Note: The period and prices of moving averages are considered by the author on the H1 hourly chart and differs from the general definition of the classic daily moving averages on the daily D1 chart.
Bollinger Bands
A breakthrough of the upper border of the indicator in the area of 1.3770 will lead to a new wave of growth of the pound. Surpassing the lower border of the indicator in the area of 1.3744 will increase the pressure on the pair.
Description of indicators
- Moving average (moving average, determines the current trend by smoothing out volatility and noise). Period 50. It is marked in yellow on the chart.
- Moving average (moving average, determines the current trend by smoothing out volatility and noise). Period 30. It is marked in green on the chart.
- MACD indicator (Moving Average Convergence/Divergence — convergence/divergence of moving averages) Quick EMA period 12. Slow EMA period to 26. SMA period 9
- Bollinger Bands (Bollinger Bands). Period 20
- Non-commercial speculative traders, such as individual traders, hedge funds, and large institutions that use the futures market for speculative purposes and meet certain requirements.
- Long non-commercial positions represent the total long open position of non-commercial traders.
- Short non-commercial positions represent the total short open position of non-commercial traders.
- Total non-commercial net position is the difference between short and long positions of non-commercial traders.