Analyzing Friday's trades:
GBP/USD on 30M chart
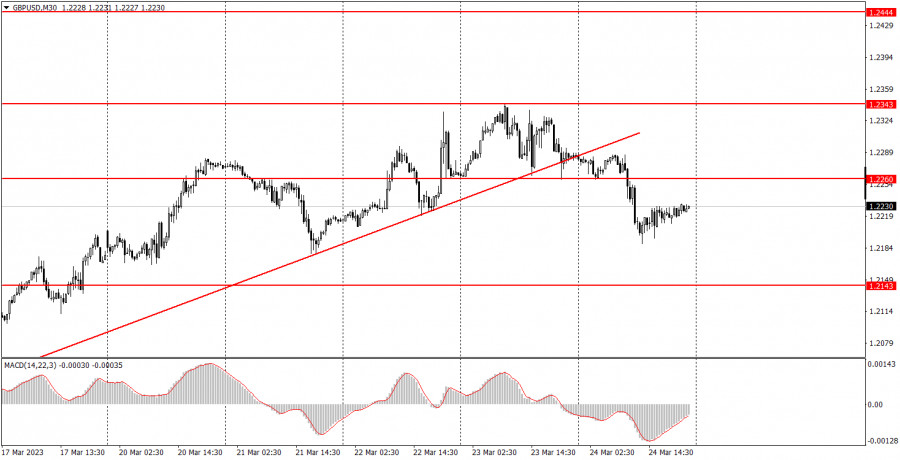
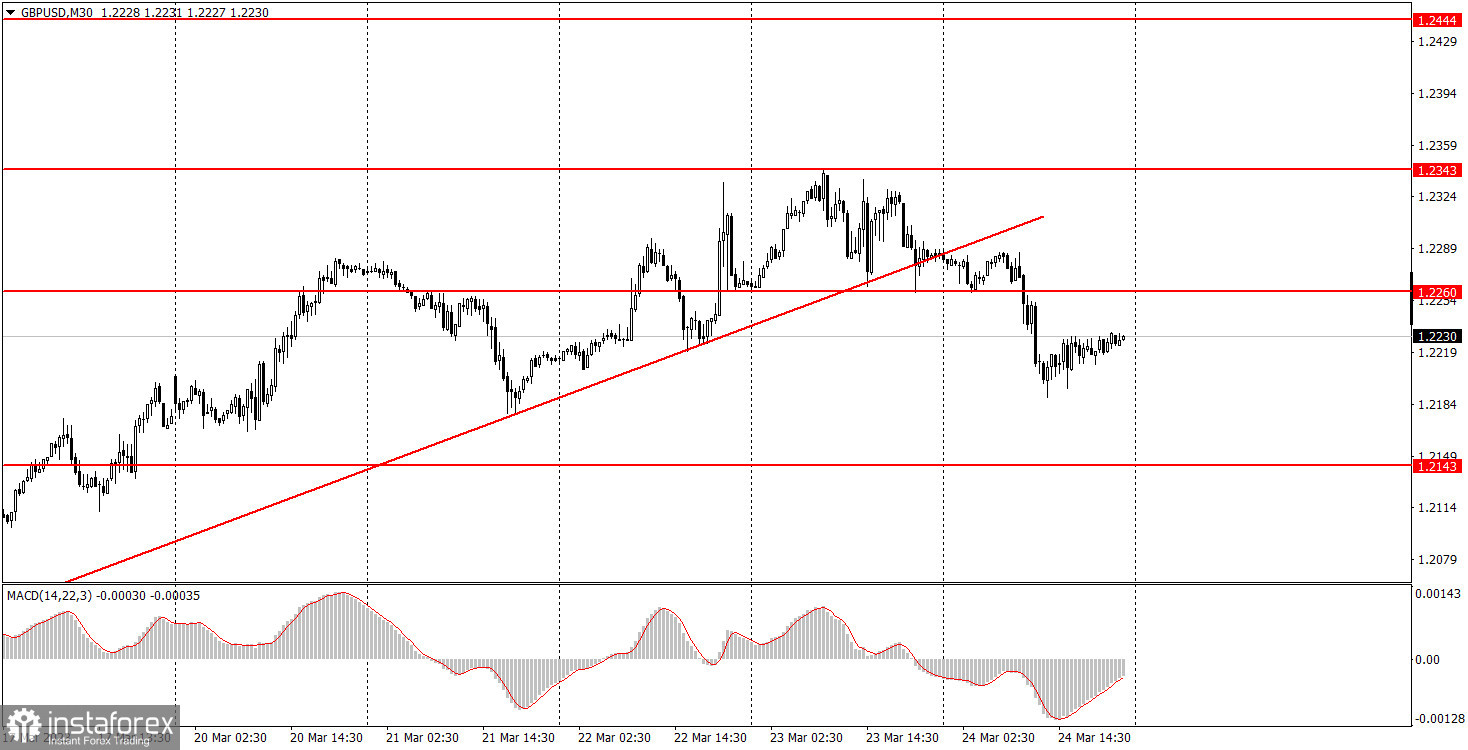
On Friday, GBP/USD settled below the ascending trend line and also began a bearish corrective movement. I've already mentioned that we are just waiting for the uptrend to end and for the pound to fall, because the currency's growth during the last weeks was not justified either. Market participants often interpreted the incoming data one-sidedly, only in favor of the pound. On Friday, the picture was quite logical. PMIs in Britain were weaker than expected; retail sales, though increased by 1.2% in February, were not so interesting for traders that they priced this data. In general, if you want, you can say that the pound fell not because of the macro data, but more for technical reasons. But I'm not surprised anyway, because the key factor - the monetary policy of the Bank of England - continues to raise a lot of questions. Inflation in Britain remains at the highest level, but at the same time, the central bank has already slowed down the rate hike and it appears that it will not be able to continue tightening for a long time.
GBP/USD on 5M chart
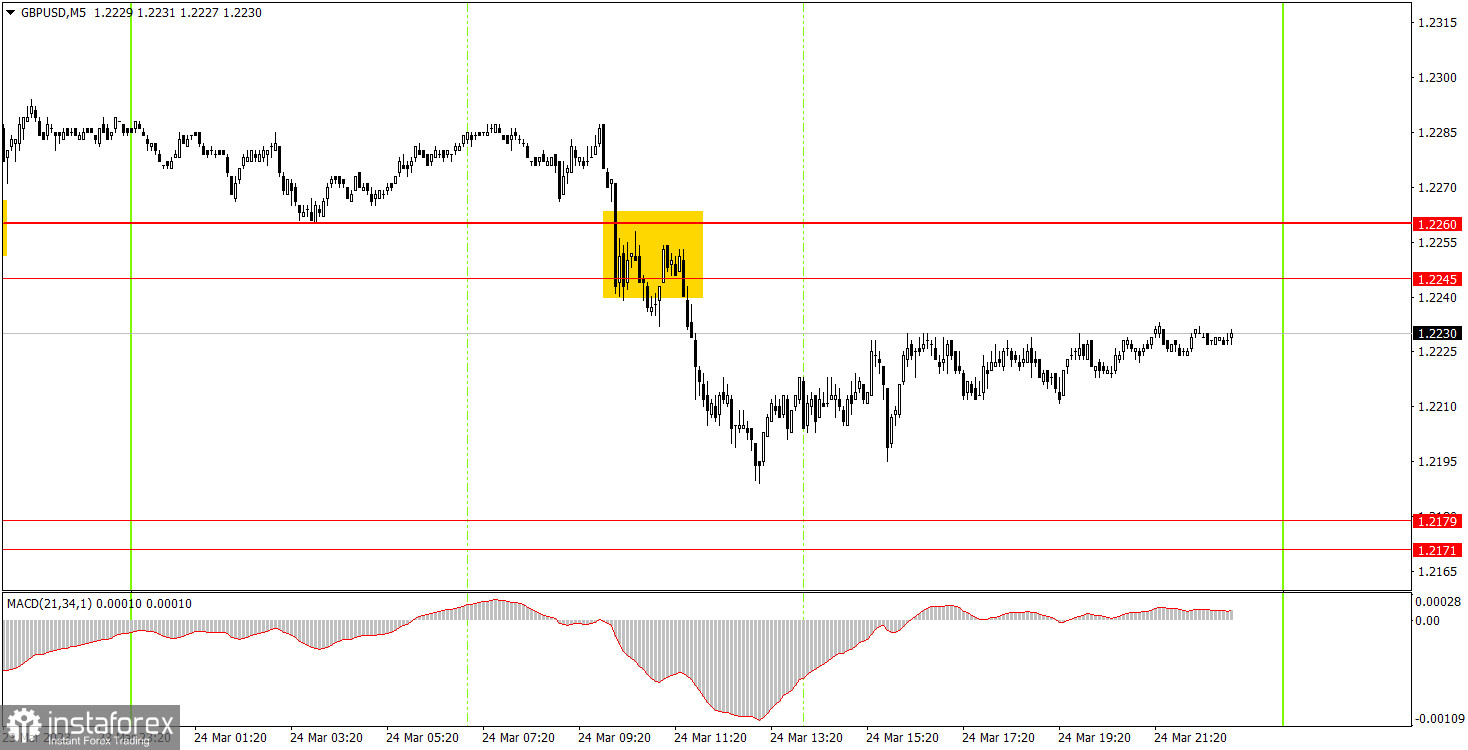
On the 5-minute chart, there was only one sell signal near 1.2245-1.2260. After that the pair went down 48 pips, but failed to reach the nearest target level of 1.2179. Till the end of the day no other signal was formed, so beginners had to close the deal manually. In any case, a profit was gained by it, because the pair did not return to the point where the signal was formed. Thus, the profit was obtained, although it was not the highest.
Trading tips on Monday:
On the 30-minute chart, GBP/USD continues to trade in a classic "swing" mode, but in the long term. We can say that the meetings of the Federal Reserve and the BoE did not provoke discouraging movements, the market reacted relatively calmly. Now we wait for the bearish correction since the pound has risen for several weeks. Actually, the bearish correction has started but so far it has been weak, so let's wait for the pound to fall further. On the 5-minute chart, it is recommended to trade at the levels 1.1924, 1.1992-1.2008, 1.2065-1.2079, 1.2143, 1.2171-1.2179, 1.2245-1.2260, 1.2337-1.2343, 1.2387, 1.2444-1.2471. As soon as the price passes 20 pips in the right direction, you should set a Stop Loss to breakeven. On Monday, BoE Governor Andrew Bailey is set to give a speech in Britain, which is always interesting, because he speaks very rarely. We expect to hear answers on monetary policy, in regards to how long and how much the rates will grow. The tougher the answer (if at all), the higher the chance that the pound rises further.
Basic rules of the trading system:
1) The strength of the signal is determined by the time it took the signal to form (a rebound or a breakout of the level). The quicker it is formed, the stronger the signal is.
2) If two or more positions were opened near a certain level based on a false signal (which did not trigger a Take Profit or test the nearest target level), then all subsequent signals at this level should be ignored.
3) When trading flat, a pair can form multiple false signals or not form them at all. In any case, it is better to stop trading at the first sign of a flat movement.
4) Trades should be opened in the period between the start of the European session and the middle of the US trading hours when all positions must be closed manually.
5) You can trade using signals from the MACD indicator on the 30-minute time frame only amid strong volatility and a clear trend that should be confirmed by a trendline or a trend channel.
6) If two levels are located too close to each other (from 5 to 15 pips), they should be considered support and resistance levels.
On the chart:
Support and Resistance levels are the levels that serve as targets when buying or selling the pair. You can place Take Profit near these levels.
Red lines are channels or trend lines that display the current trend and show in which direction it is better to trade now.
The MACD indicator (14, 22, and 3) consists of a histogram and a signal line. When they cross, this is a signal to enter the market. It is recommended to use this indicator in combination with trend patterns (channels and trendlines).
Important announcements and economic reports that can be found on the economic calendar can seriously influence the trajectory of a currency pair. Therefore, at the time of their release, we recommend trading as carefully as possible or exiting the market in order to avoid sharp price fluctuations.
Beginners on Forex should remember that not every single trade has to be profitable. The development of a clear strategy and money management is the key to success in trading over a long period of time.