empty
11.01.2022 05:24 PM
Trading signals for USD/CAD on January 11 - 12, 2022: buy above 1.2625 (200 EMA)

This image is no longer relevant

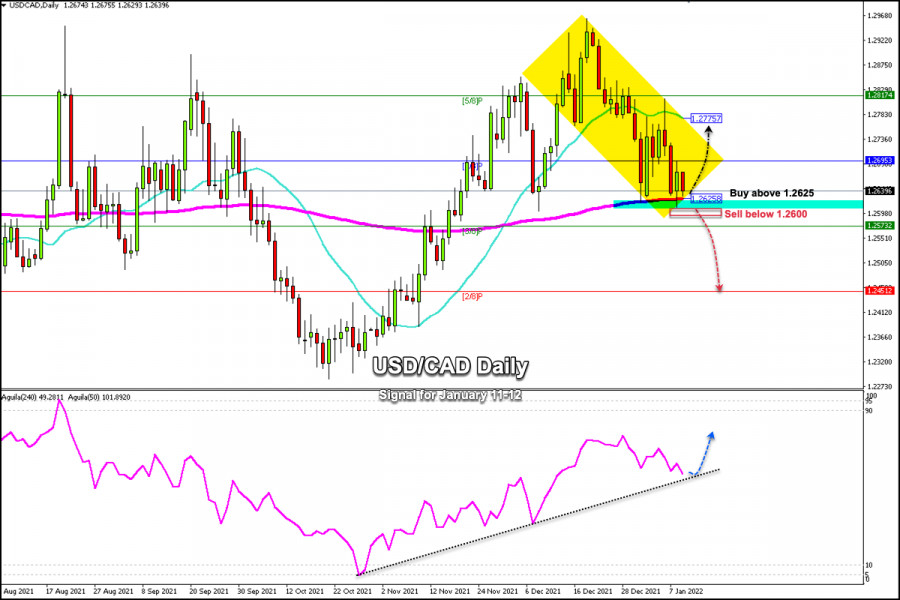
According to the daily chart, USD / CAD is located above the 200 EMA with an accumulation of candles which shows that it is struggling to maintain its uptrend.

On previous occasions, the currency pair has been bouncing around the zone of 1.26 moving towards 1.28.

The loonie is expected to bounce above 1.2625 (200 EMA) with targets towards 1.2695 and up to the 21 SMA at 1.2775.

According to the daily chart, the USD / CAD pair still maintains its upward trend in view of the fact that it is located above the EMA of 200.

The outlook remains on the upside. The tarding instrument is expected to reach the level of 1.28 and up to 1.30 in the next few days only if it is above 1.26.

Since October 22, 2021, the Eagle indicator has been giving a bullish signal. On December 6, the moving average touched the trend channel and the price rebounded, thus giving the CAD momentum to break above the level 1.29.

USD / CAD is likely to be approaching this trend line. So, the currency pair could gain momentum and resume its bullish move with targets at 1.2817 (5/8) and towards the psychological level of 1.30.

On the contrary, a daily close below 1.26 is likely to be the beginning of a bearish scenario and a drop towards 1.2500 and up to 2/8 Murray around 1.2451 would be expected.

Our trading plan is to watch the level of 1.2625. As long as it is trading around this area, we will have opportunities to buy. Our first targets are 1.2695, 1.2775, and 1.2817.

Support and Resistance Levels for January 11 - 12, 2022

Resistance (3) 1.2756

Resistance (2) 1.2695

Resistance (1) 1.2660

----------------------------

Support (1) 1.2571

Support (2) 1,2536

Support (3) 1,2507

***********************************************************


Scenario

Timeframe daily

Recommendation: buy above

Entry Point 1.2625

Take Profit 1.2695 (4/8), 1.2775 (21 SMA)

Stop Loss 1.2590

Murray Levels 1.2695 (4/8) 1.2817 (5/8)

***********************************************************


Alternative scenario

Recommendation: sell if breaks

Entry Point 1.26

Take Profit 1.2500, 1.2451 (2/8)

Stop Loss 1.2639

Murray Levels 1.2573 (3/8), 1.2451 (2/8)

*********************************************************

Pilih carta masa
5
min
15
min
30
min
1
jam
4
jam
1
hari
1
minggu
Jana pendapatan melalui perubahan kadar mata wang kripto dengan InstaForex.
Muat turun MetaTrader 4 dan buka dagangan pertama anda.
  • Grand Choice
    Contest by
    InstaForex
    InstaForex always strives to help you
    fulfill your biggest dreams.
    SERTAI PERADUAN

Artikel yang dicadangkan

Ramalan untuk GBP/USD pada 15 Mei 2025

Pada carta jam, pasangan GBP/USD naik ke zon rintangan 1.3344–1.3357 pada hari Rabu, melonjak dari zon tersebut, dan mula bergerak ke bawah menuju tahap Fibonacci 100.0% pada 1.3205. Sehingga pagi

Samir Klishi 10:56 2025-05-15 UTC+2

Analisis Teknikal Pergerakan Harga Harian Pasangan Mata Wang Eksotik USD/IDR, Khamis 15 Mei 2025

Berdasarkan carta harian, pasangan mata wang eksotik USD/IDR menunjukkan corak Bearish 123 diikuti oleh kemunculan 2 Bearish Ross Hook (RH) yang memberikan petunjuk bahawa mata wang USD mula melemah berbanding

Arief Makmur 06:46 2025-05-15 UTC+2

Analisis Teknikal Pergerakan Harga Harian Indeks Nasdaq 100, Khamis 15 Mei 2025

Jika kita melihat carta 4 jam untuk indeks Nasdaq 100 yang bergerak di atas WMA (21) yang mempunyai cerun ke atas, ini menunjukkan bahawa ketika ini Pembeli masih agak dominan

Arief Makmur 06:46 2025-05-15 UTC+2

Ramalan EUR/USD untuk 15 Mei 2025

Pada hari Rabu, euro berjaya meningkat ke tahap sasaran 1.1266 (paras terendah pada 15 April dan 1 Mei), tetapi tanpa sokongan luaran (S&P 500 naik sebanyak 0.10%, manakala Dow Jones

Laurie Bailey 04:40 2025-05-15 UTC+2

Ramalan GBP/USD untuk 15 Mei 2025

Pound British masih bergelut untuk menembusi paras rintangan 1.3311 dengan penutupan lilin harian. Dalam konteks semasa, paras ini sejajar dengan garis sifar (neutral) pada pengayun Marlin harian. Menariknya, garis isyarat

Laurie Bailey 04:40 2025-05-15 UTC+2

Ramalan USD/JPY untuk 15 Mei, 2025

Menjelang akhir sesi dagangan semalam, pasangan USD/JPY menurun sebanyak 73 pip, menguji garis penunjuk MACD dengan bayang bawah lilin. Jelas bahawa terdapat percubaan untuk mengukuh dalam julat 145.08–145.91, namun usaha

Laurie Bailey 04:40 2025-05-15 UTC+2

Isyarat Dagangan EUR/USD untuk 14-19 Mei 2025: jual di bawah 1.1230 (200 EMA - 21 SMA)

Euro dijangka akan terus jatuh dalam beberapa jam akan datang. Oleh demikian, kita patut menjangkakan penutupan di bawah 1.1186 pada carta H4. Kemudian, harga mungkin turun ke 1.1080 dan bahkan

Dimitrios Zappas 18:06 2025-05-14 UTC+2

Isyarat Dagangan untuk EMAS bagi 14-19 Mei, 2025: beli di atas $3,175 (200 EMA - lantunan)

Emas meninggalkan jurang sekitar 3,325. Jurang ini berkemungkinan akan diisi dalam beberapa hari akan datang. Untuk ini, kita perlu menunggu emas untuk mengukuh di atas 3,230, kemudian prospeknya akan menjadi

Dimitrios Zappas 18:05 2025-05-14 UTC+2

WTI - West Texas Intermediate. Analisis dan Ramalan

Harga minyak mentah West Texas Intermediate (WTI) AS sedang mengukuh berhampiran paras tertinggi bulanan, menghentikan rentetan kemenangan selama empat hari, walaupun penurunan intraday kekal tanpa keyakinan menurun yang kukuh. Harga

Irina Yanina 17:55 2025-05-14 UTC+2

Analisis EUR/USD pada 14 Mei 2025

Pada hari Selasa, pasangan EUR/USD melonjak dari zon sokongan 1.1074–1.1081 dan berpihak kepada euro, naik sebanyak 110 mata. Oleh itu, kegembiraan para penjual adalah bersifat sementara. Pengukuhan pasangan di atas

Samir Klishi 11:20 2025-05-14 UTC+2
Tidak boleh bertanya sekarang?
Tanya soalan anda di Ruangan bersembang.
Panggilan semula Widget
 

Dear visitor,

Your IP address shows that you are currently located in the USA. If you are a resident of the United States, you are prohibited from using the services of InstaFintech Group including online trading, online transfers, deposit/withdrawal of funds, etc.

If you think you are seeing this message by mistake and your location is not the US, kindly proceed to the website. Otherwise, you must leave the website in order to comply with government restrictions.

Why does your IP address show your location as the USA?

  • - you are using a VPN provided by a hosting company based in the United States;
  • - your IP does not have proper WHOIS records;
  • - an error occurred in the WHOIS geolocation database.

Please confirm whether you are a US resident or not by clicking the relevant button below. If you choose the wrong option, being a US resident, you will not be able to open an account with InstaForex anyway.

We are sorry for any inconvenience caused by this message.