To open long positions on EUR/USD you need:
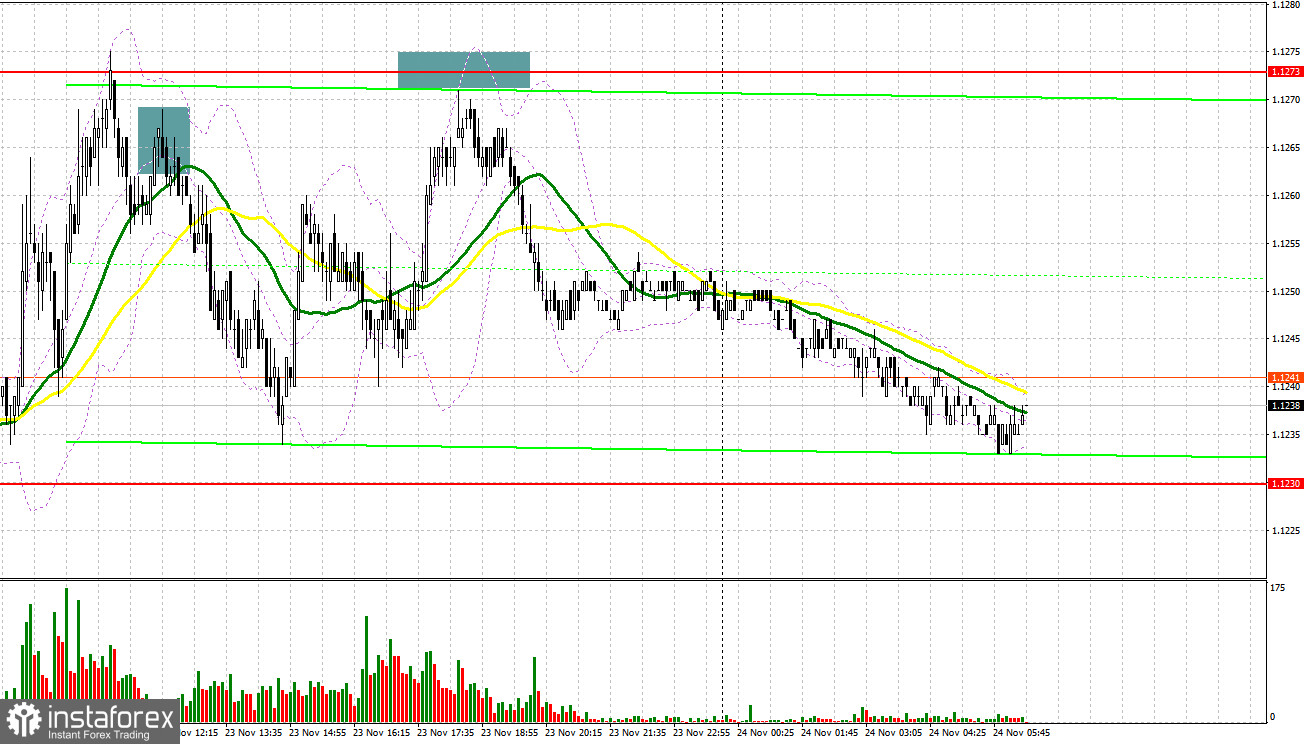
Yesterday, only one signal to sell the euro was formed. Let's observe the 5-minute chart and analyze it. Besides, in the first half of the day the data on the EU manufacturing and service sector activity surprised the traders as it turned out to be much better than economists forecasted, which led to the strengthening of the European currency against the US dollar. However, buyers faced the first problem in the area of 1.1263. A failed attempt to break above this range and pair's return under this level caused a false break and formed a signal for opening short positions in the downtrend. The downside movement was about 30 pips, though the pair failed to update the weekly low. In the second half of the day, trading was carried out in the sideways channel. However, updating the indicated levels was not achieved.
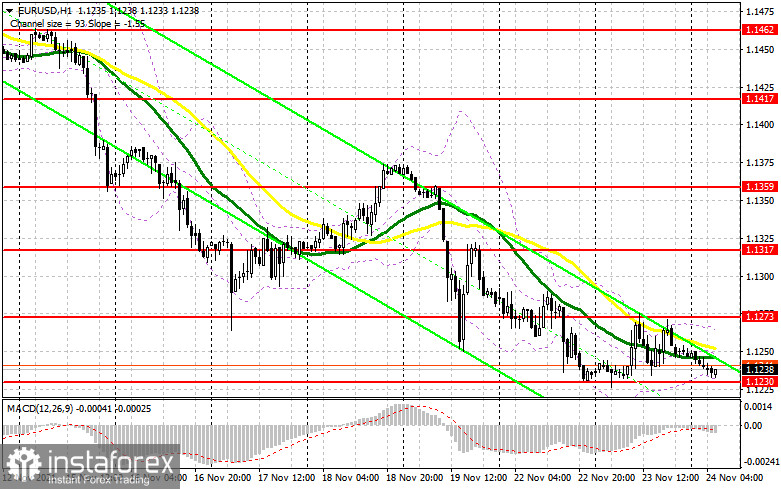
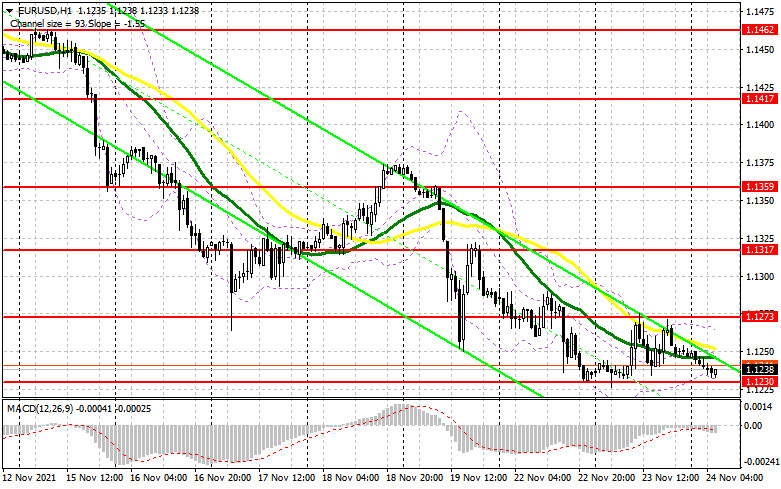
There are no significant fundamental statistics in the first half of the day, so traders' attention is likely to be focused on German IFO business sentiment data. The situation with further dynamics of the COVID-19 cases in the EU, which is exerting a serious pressure on the pair and does not allow bulls to form an upward correction, will also be decisive for the euro. In this situation the best scenario to build up long positions is a downward correction and formation of a false break near 1.1230, which is the low of the week. Taking into account favourable German data, it creates an entry point to the market with the target to further resistance at 1.1273, impossible to break above yesterday. The fact that the trading is carried out around the moving averages provides a chance for an upward correction. A break of 1.1273 will be a key task for bulls. A test of this level from the top down will provide a good entry point to 1.1317 with the further prospect for updating the high of 1.3506, where I recommend taking profits. However, it will be possible to expect the euro's rise to these highs only after the US GDP report for the third quarter of this year and the minutes of the Fed meeting are released. There are no other reasons for growth. With a scenario of EUR/USD decline to 1.1230 and weak EU data, it is better not to hurry to buy. I recommend awaiting the formation of a false break near the next support at 1.1193. It is possible to open long positions on EUR/USD immediately at a rebound from the low at 1.1155 or even lower, from 1.1106, counting on a correction of 15-20 pips during the day.
To open short positions on EUR/USD you need:
A key target for euro sellers in the near future will be a consolidation below the lows of the week around 1.1230. Only a break and a reverse test of this area from the bottom up with weak business sentiment data, current market sentiment and German economic sentiment from the IFO institute form a good signal to sell the euro further according to the trend with the prospect of updating the low at 1.1193. A further target is the support at 1.1155, where I recommend taking profit. If in the first half of the day it is possible to observe another bull's attempt to form an upward correction, bears will most likely protect the resistance at 1.1273 again. Formation of a false break there would provide an excellent entry point into short positions. If bears demonstrate no activity at 1.1273, it might be better not to open short positions until the key level of 1.1317 is updated. Formation of a false break at this point will be a good option to sell the euro further according to the trend. The best way to open short positions on the rebound would be the high near 1.1359. It is possible to count on a downward correction of 15-20 pips.
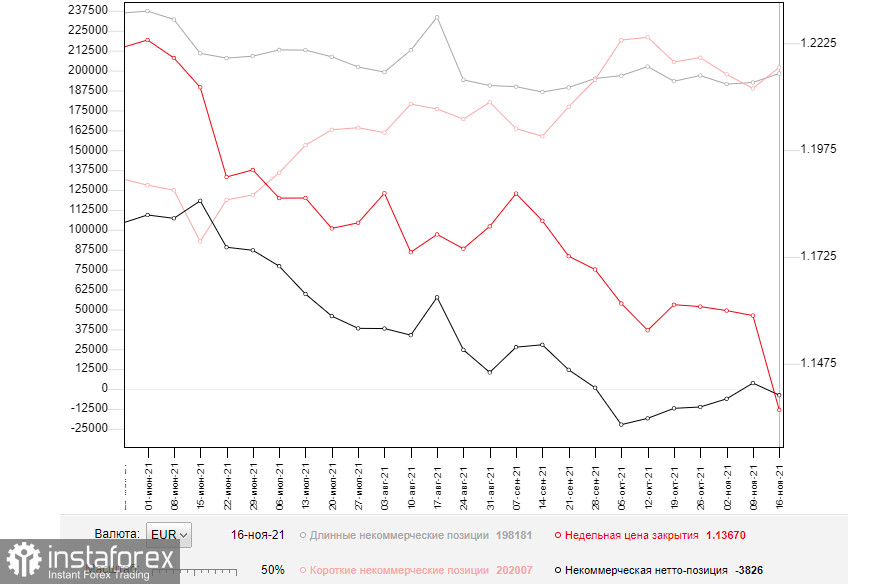
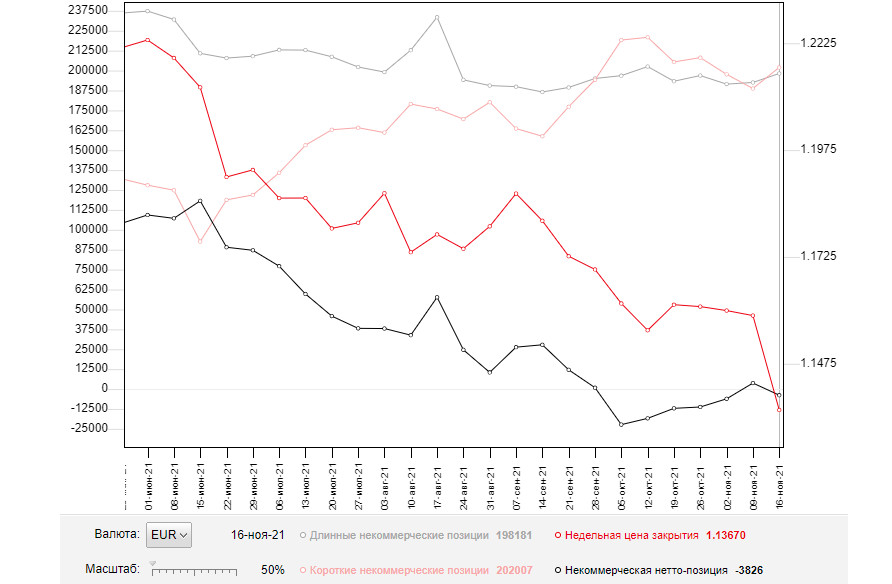
The COT report (Commitment of Traders) for November 16 recorded an increase in both short and long positions. However, the first ones were numerous, which led to a further negative delta. Although it has been balancing in the same range near the zero level for quite a long time, it is not favourable for euro buyers. The risk of another coronavirus outbreak and the EU countries' lockdown caused further pressure on the European currency, which has not managed to recover from the European Central Bank's continued extra dovish monetary policy yet, even amid inflationary growth. Judging this aspect, ECB policymakers have taken a fairly right stance. Austria has already returned to lockdown restrictions and strict isolation measures, while German authorities are considering them. Besides, it is a very clear signal for a further weakening of the euro against the dollar. Meanwhile, the US high inflationary pressure continues to support the US dollar. Many investors expect an earlier interest rate hike by the Federal Reserve next year and are already following the market in that direction. The latest November COT report indicated that long non-commercial positions rose from 192,544 to 198,181, while short non-commercial positions also jumped from 188,771 to 202,007. At the end of the week, the total non-commercial net position relapsed negative to -3,826 versus 3,773. The weekly closing price declined significantly to 1.1367 versus 1.1587.
Indicator Signals:
Moving averages.
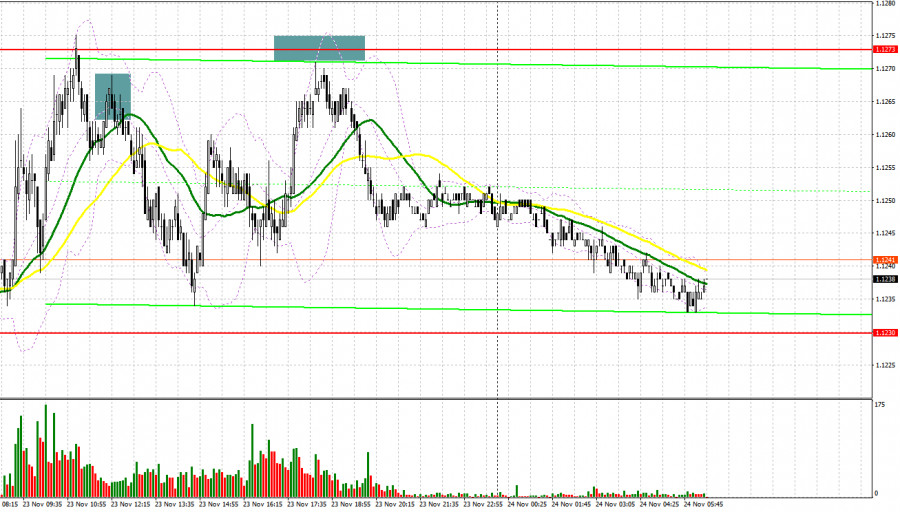
Trading is conducted near the 30 and 50 day moving averages, which will allow bulls to form an upward correction on the pair.
Note. The period and prices of moving averages are considered by the author on hourly chart H1 and differ from the common definition of classic daily moving averages on daily chart D1.
Bollinger Bands.
A break of the lower boundary of the indicator at 1.1230 will increase the pressure on the euro. A break of the upper boundary at 1.1270 will lead to the pair's growth.
Description of indicators
- Moving average (moving average determines the current trend by smoothing out volatility and noise). Period 50. On the chart, it is marked in yellow;
- Moving average (moving average determines the current trend by smoothing out volatility and noise). Period 30. On the chart, it is marked in green;
- MACD (Moving Average Convergence/Divergence - moving average convergence/divergence) Fast EMA period 12. Slow EMA period 26. SMA period 9
- Bollinger Bands (Bollinger Bands). Period 20;
- Non-commercial traders are speculators, such as individual traders, hedge funds and large institutions, which use the futures market for speculative purposes and meet certain requirements;
- Long non-commercial positions represent the total long open position of non-commercial traders;
- Short non-commercial positions represent the total short open position of non-commercial traders;
- The total non-commercial net position is the difference between short and long positions of non-commercial traders.