To open long positions on GBP/USD, you need:
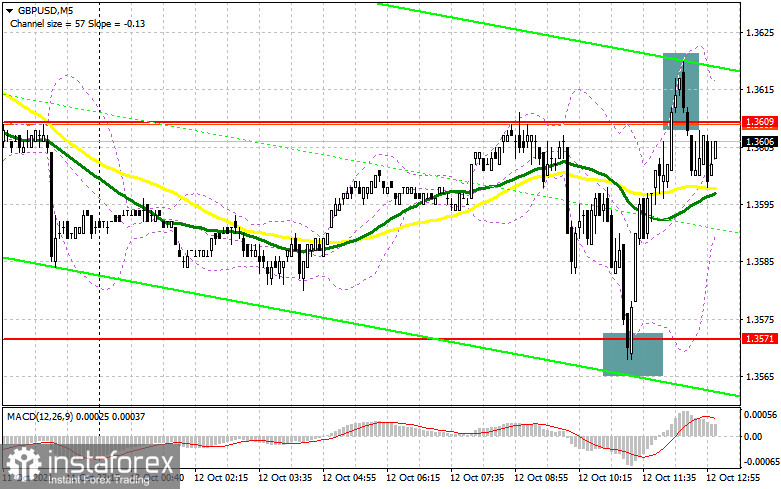
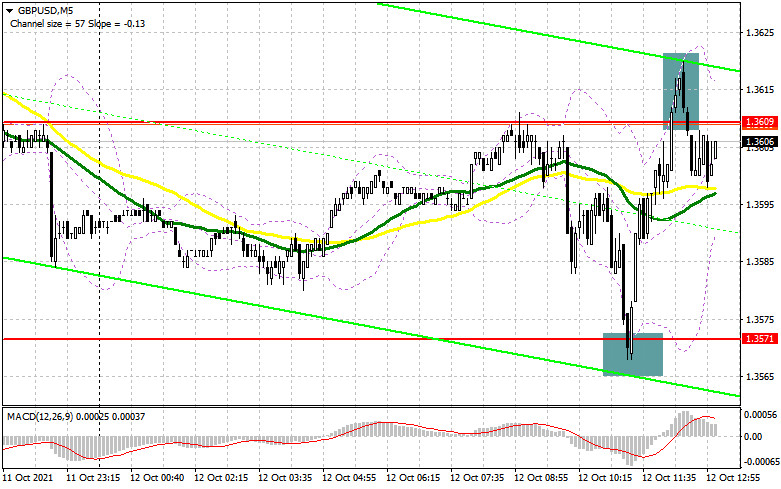
Today in the first half of the day, we have already observed the bears' attempts to continue the pair's fall, which was observed yesterday at the close of the American session. However, like buyers yesterday, sellers today also failed. Let's look at the 5-minute chart and figure out the entry points that were formed. During the European session, it is seen how the bears are trying to break below the support of 1.3571 after the report on the change in the number of applications for unemployment benefits. However, a false breakdown is formed, leading to a signal to open long positions. As a result, the pair quickly rushes up to the resistance area of 1.3609 and even tries to break through it, but to no avail. The movement was about 40 points. An unsuccessful breakdown and a return under 1.3609 forms a sell signal for the pound. However, the bears are reluctant to return to the market. From a technical point of view, nothing has changed for traders, nor has the strategy changed.
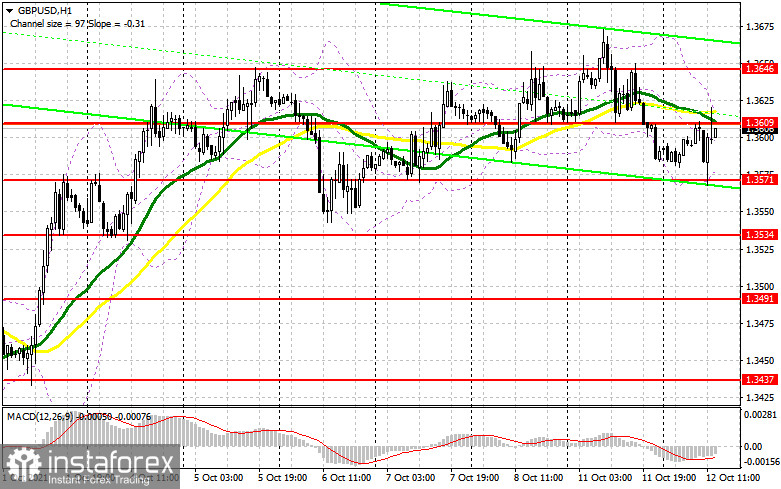
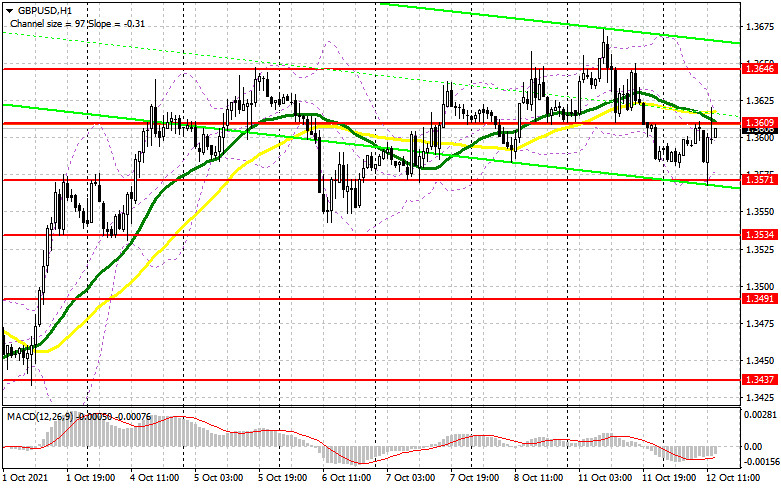
The resistance of 1.3609 remains under the bull's eye, above which the moving averages that limit the upward potential of the pair pass. The level was formed yesterday afternoon, so it is intermediate. Only a breakthrough and a reverse test of this range from top to bottom will form a buy signal for GBP/USD, which will push the pair even higher - to the area of 1.3646. A test of this area will be evidence of the continuation of the bullish trend, but for greater confidence, you need to consolidate higher. A breakdown of this area will also directly lead to a large resistance of 1.3691, where I recommend taking the profits. If the pressure on the pair returns in the afternoon after strong reports on the US economy, an important task for the bulls will be to protect the support of 1.3571, which they coped with perfectly during the European session. Only the formation of a false breakdown there forms a good entry point into purchases. Otherwise, the optimal scenario for opening long positions will test the next support of 1.3534. However, it is best to wait for the formation of a false breakdown. I advise you to look at long positions of GBP/USD immediately for a rebound only from the minimum of 1.3491, based on an upward correction of 25-30 points within a day.
To open short positions on GBP/USD, you need:
The bears tried to regain control of the market, but they failed. Now is the time to think about how to protect 1.3609. So far, the formation of a false breakdown at this level in the first half of the day has not led to a serious downward movement of the pair, which may force the bulls to act more actively in the near future. An important task of the bears remains the formation of a false breakdown in the resistance area of 1.3609. After that, it will be possible to resort to building up short positions. This option will push GBP/USD to the morning support of 1.3571 again. A breakout and a reverse test of this range from the bottom up will form a signal to open short positions and increase pressure on the pair to further decrease to a minimum of 1.3534, and then to support 1.3491, where I recommend taking the profits. In the case of recovery of the pound in the second half and the absence of bear activity at 1.3609, only the formation of a false breakdown in the resistance area of 1.3646 will be a signal to sell GBP/USD. I advise you to immediately open short positions on the pound for a rebound from a larger resistance of 1.3691, or even higher - from a maximum of 1.3726, counting on the pair's rebound down by 20-25 points inside the day.
The COT reports (Commitment of Traders) for October 5 recorded a sharp increase in short positions and a reduction in long positions, which led to a move to the negative zone of the total net position. Despite a fairly active recovery of the pair a week earlier, it was not possible to continue the bullish trend for the pound. However, there were all the prerequisites for this. As the data showed, problems in the supply chains in the UK remain at a fairly high level, which causes prices to creep up. It is unlikely that such a development of the situation will force the Bank of England to stand aside for a long time and watch the inflationary spiral unfold. The minutes of the meeting of the British regulator, which was published a week earlier, indicated that changes in monetary policy could be adopted as early as November this year. Therefore, the only problem that stands in the way of buyers of the pound is the US Federal Reserve System. Although it is not going to raise interest rates, it is also heading for tightening monetary policy. Despite all this, I advise buying the pound with its significant corrections, as the growth of the trading instrument is expected in the medium term. The COT report indicates that long non-commercial positions decreased from the level of 57,923 to 48,137.
In contrast, short non-commercial positions jumped from the level of 55,959 to the level of 68,155, which led to a partial increase in the advantage of sellers over buyers. As a result, the non-commercial net position returned to the negative zone and dropped from the 1964 level to the -20018 level. The closing price of GBP/USD dropped 1.3606 against 1.3700 at the end of the week.
Signals of indicators:
Moving averages
Trading is conducted below 30 and 50 daily moving averages, which indicates that the bears maintain control over the market.
Note: The author considers the period and prices of moving averages on the hourly chart H1 and differ from the general definition of the classic daily moving averages on the daily chart D1.
Bollinger Bands
A breakthrough of the upper limit of the indicator in the area of 1.3618 will lead to a new wave of growth of the pound. A break of the lower limit in the area of 1.3580 will increase the pressure on the pair.
Description of indicators
- Moving average (moving average determines the current trend by smoothing out volatility and noise). Period 50. The graph is marked in yellow.
- Moving average (moving average determines the current trend by smoothing out volatility and noise). Period 30. The graph is marked in green.
- MACD indicator (Moving Average Convergence / Divergence - moving average convergence/divergence) Fast EMA period 12. Slow EMA period 26. SMA period 9
- Bollinger Bands (Bollinger Bands). Period 20
- Non-profit speculative traders, such as individual traders, hedge funds, and large institutions that use the futures market for speculative purposes and meet specific requirements.
- Long non-commercial positions represent the total long open position of non-commercial traders.
- Short non-commercial positions represent the total short open position of non-commercial traders.
- Total non-commercial net position is the difference between the short and long positions of non-commercial traders.