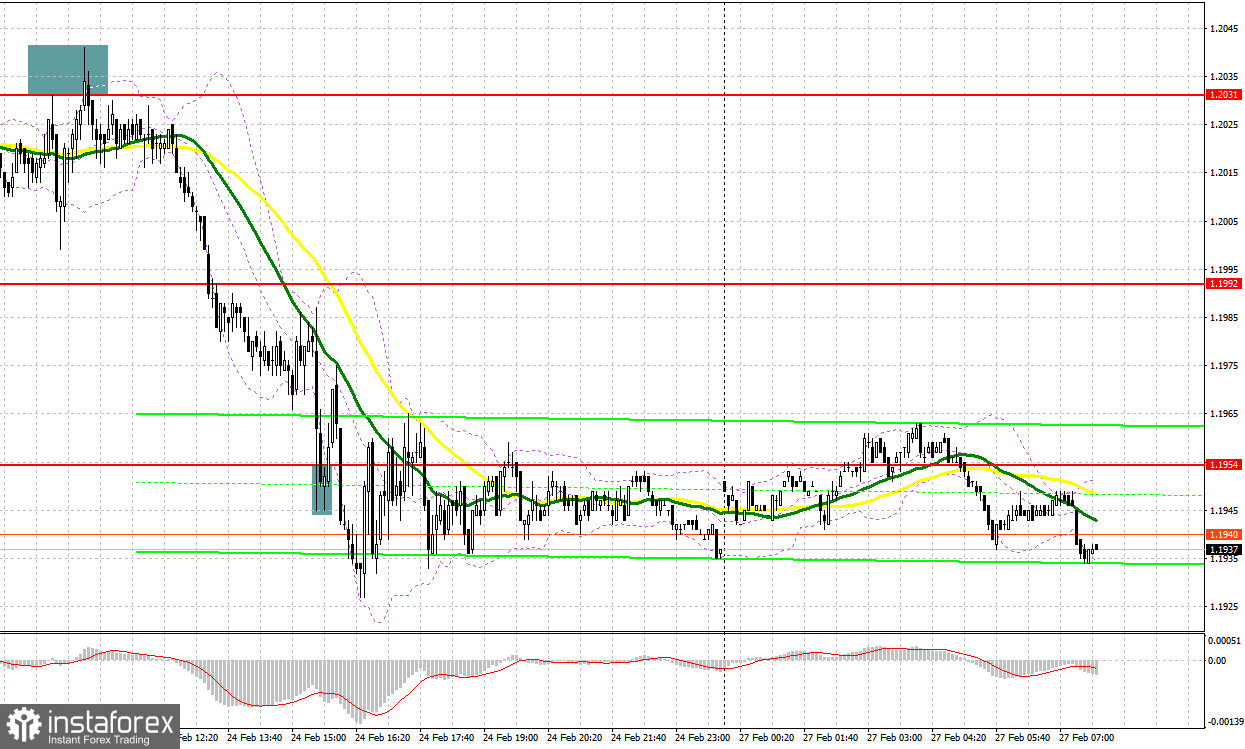
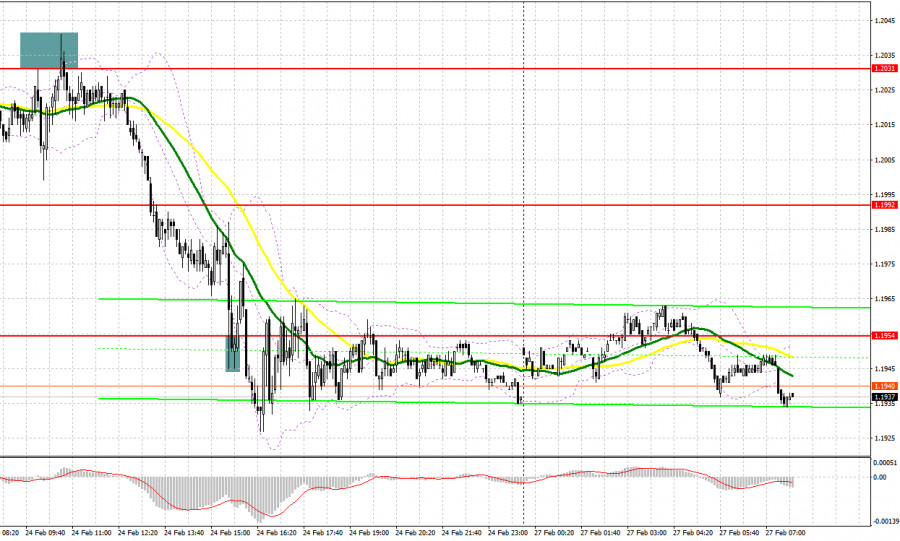
Last Friday, a few signals were generated. Let's take a look at the 5-minute chart and see what happened. In my morning forecast, I paid attention to the level of 1.2031 and recommended that you focus on it while making a decision on entering the market. A rally followed by a false breakout at that mark created a strong sell signal, which led to a downward movement of more than 30 pips. Then a false breakout at 1.1954 gave hope for a bullish correction. The pound sterling advanced by 15 pips before coming under pressure again.
To open long positions on GBP/USD, you need:
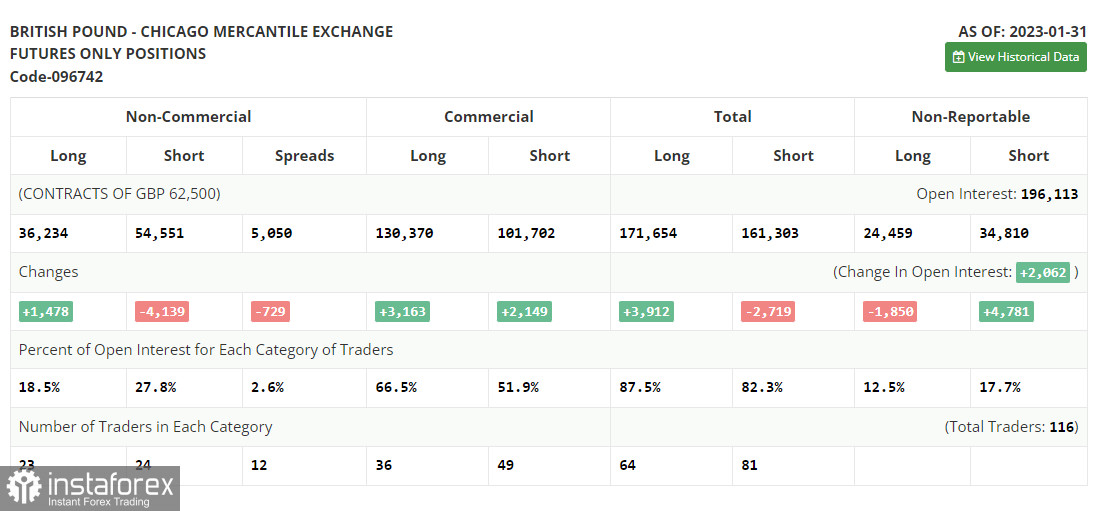
Before we go into technical analysis, let's consider the situation in the futures market. The COT report (Commitment of Traders) for January 31 recorded an increase in long positions and a decrease in short ones. Obviously, traders were betting on further interest rate hikes by the Bank of England. Therefore, they preferred to exit the market ahead of the meeting. Please bear in mind that this data is of no interest now since statistics from a month ago are not relevant due to a cyberattack on the CFTC. Traders will wait for new reports and rely on more recent data. This week's macroeconomic calendar is bereft of any important releases from the United States except for of a couple of reports, so the pressure on risky assets may ease slightly. This could help the British pound recover. The latest COT report showed that short non-commercial positions decreased by 4,139 to 54,551, while long non-commercial positions increased by 1,478 to 36,234. As a result, a negative value of the non-commercial net position reduced to -18,317 from -23 934 a week earlier. The weekly closing price fell to 1.2333 from 1.2350.
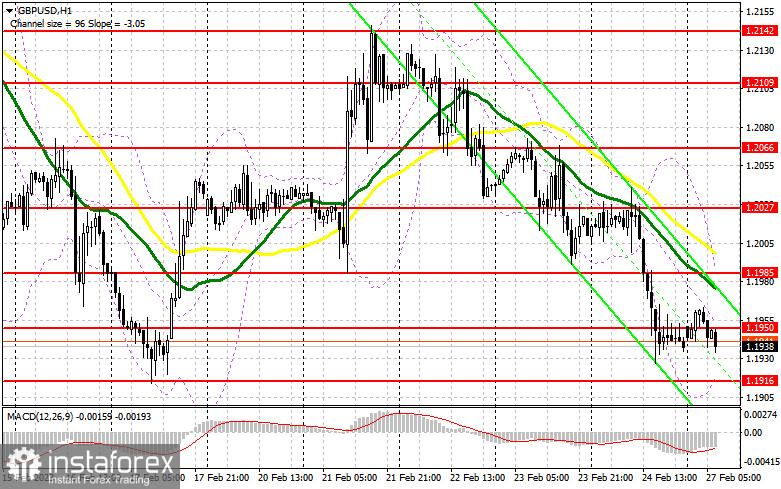
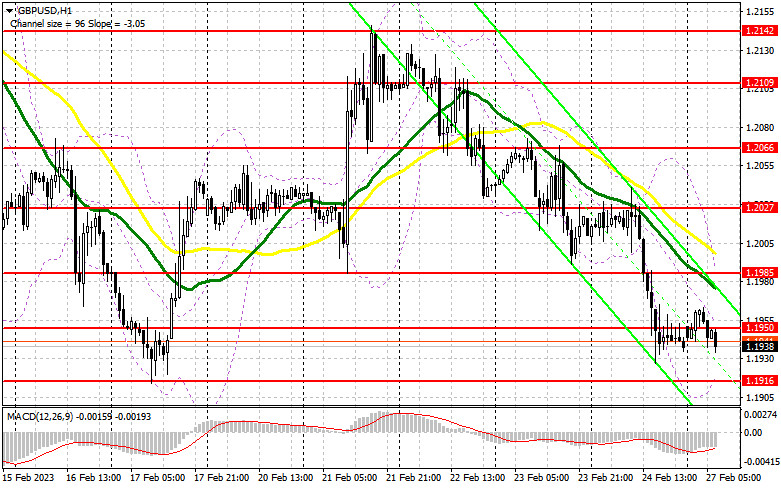
The pound sterling is one step away from hitting a new one-month low. The British currency may receive support from a speech by Bank of England's Deputy Governor for Monetary Policy Ben Broadbent, who may once again speak out in favor of further interest rate increases. In the event of a continued decline, only a false breakout at 1.1916, a one-month low, will create a buy signal. In this case, the pound sterling will most likely return to the intermediate resistance level of 1.1950 and then even rise to 1.1985, the area of moving averages. If the price breaks through and consolidates above the latter, the pair will extend gains. Moreover, if the price overcomes 1.1985 and tests it from the top down, the way to 1.2027 will open. At this mark, it would be a wise decision to lock in profits. The most distant target will be the area of 1.2066. Its breakout will lead to a major rally. If the pair slides amid buyers' subdued trading activity at 1.1916, the pound will keep trading under pressure. In this case, I recommend that you put off going long until the price reaches 1.1875. At this level, long positions can be considered only amid a false breakout. Going long on a rebound will be relevant at 1.1829 with a view to catching an intraday correction of 30-35 pips.
To open short positions on GBP/USD, you need:
The pound sterling slid, weighed down by strong US data released on Friday. Now sellers have every chance of dragging the price further down. However, bears first need to regain control of 1.1950 and then break below 1.1916. If the pound sterling gains after Ben Broadbent's speech, a false breakout at 1.1950 will create a sell signal. In this case, the pair will most likely dip to the nearest support level of 1.1916. Its breakout and bottom-to-top test will make it possible to sell the pair, counting on a fall below the low of 1.1829. A more distant target will be the area of 1.1781, where I recommend locking in profits. Alternatively, if the pair rallies amid bears' subdued trading activity at 1.1950, it is expected to advance to the one-month high of 1.1985. In case of a false breakout at this level, a sell signal will be generated. If the price breaks above 1.1985 and edges higher, traders are recommended to go short at 1.2027 in the hope that the pair will go down by 30-35 pips.
Traders are recommended to read the following articles:
Indicator signals:
Moving averages
The quotes are trading below 30- and 50-day moving averages, which indicates a downtrend.
Note: The period and prices of moving averages are considered by the author on the 1-hour chart and differ from the general definition of the classic daily moving averages on the daily chart.
Bollinger Bands
In case of a rally, the upper bound of the indicator around 1.1985 will act as resistance. In case the pair goes down, the lower bound of the indicator around 1.1915 will serve as support.
Description of indicators
- The 50-day moving average determines the current trend by smoothing volatility and noise. It is marked in yellow on the chart.
- The 30-day moving average determines the current trend by smoothing volatility and noise. It is marked in green on the chart.
- The MACD indicator (Moving Average Convergence/Divergence - convergence/divergence of moving averages). Fast EMA period 12. Slow EMA period 26. SMA period 9
- Bollinger Bands. Period 20
- Non-commercial traders are speculators such as individual traders, hedge funds, and large institutions that use the futures market for speculative purposes and meet certain requirements.
- Long non-commercial positions represent the total long open position of non-commercial traders.
- Short non-commercial positions represent the total short open position of non-commercial traders.
- The total non-commercial net position is the difference between short and long positions of non-commercial traders.