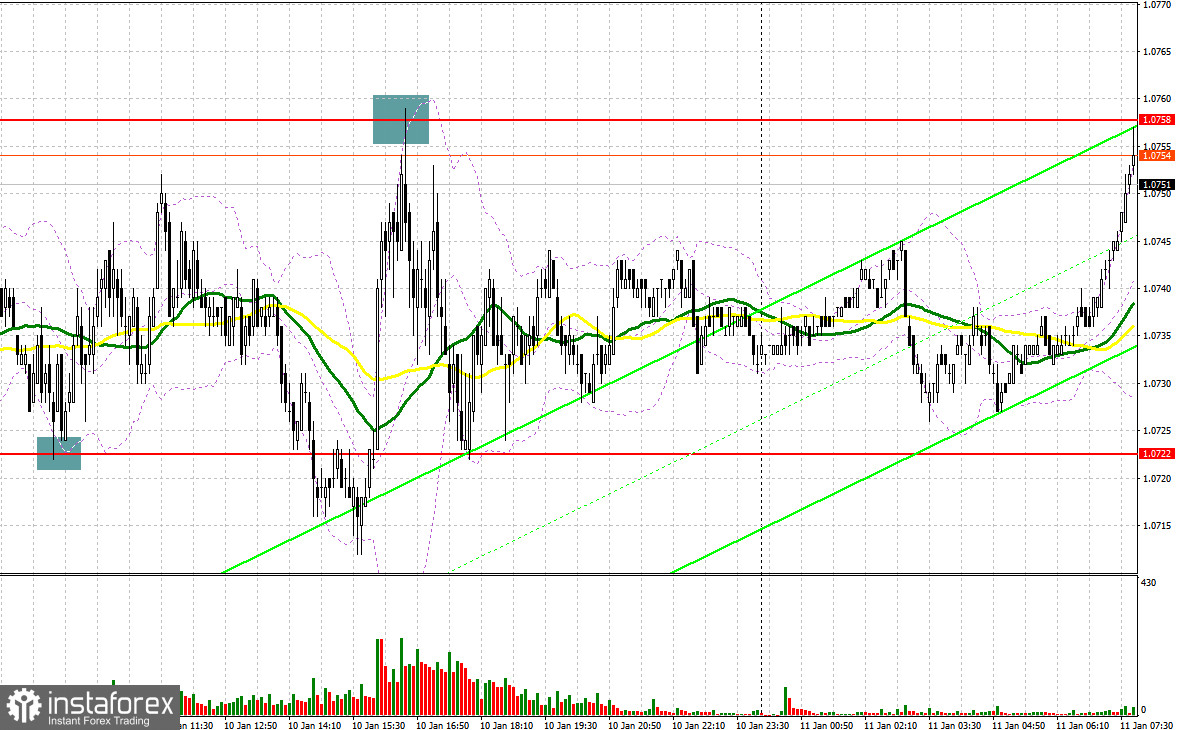
A few entry signals were generated yesterday. Let's take a look at the M5 chart to get a picture of what happened. In the previous review, we focused on the level of 1.0722 and considered entering the market there. A fall and a false breakout through the mark produced a buy signal in the wake of an empty macroeconomic calendar and the pair's limited upside potential. The pair ascended by 25 pips. In the second half of the day, the quote settled above 1.0758. A false breakout generated a sell signal, and the price eventually fell by 40 pips.
When to go long on EUR/USD:
The market focused solely on Jerome Powell's speech yesterday. However, the chairman abstained from commenting on monetary policy. He stressed the case for monetary policy independence and promised to tame inflation. Unfortunately, today's macroeconomic calendar is also empty. So, there are hardly any fundamental factors able to affect the pair. The buyers are likely to use the lack of selling activity in the past few days to push the price to a fresh high. Anyway, an entry point will form after a fall and a false breakout through yesterday's support level of 1.0722, allowing the buyers to reach the weekly high of 1.0758. The barrier has recently been repeatedly tested. A breakout and a downside test will create an additional buy entry point. The target is seen at 1.0791. That will mark the beginning of a new uptrend. A breakout through the target level will trigger a row of bullish stop orders and make an additional signal with the target at 1.0820, where it is wiser to lock in profits. If EUR/USD goes down and there is a lack of bullish activity at 1.0722 in the first half of the day, which is highly likely, the pair will come under pressure. Therefore, a buy signal will only be produced after a false breakout through support at 1.0687. It will also become possible to go long on a rebound from the low of 1.0653 or around 1.0618, allowing a correction of 30 to 35 pips intraday.
When to go short on EUR/USD:
The sellers kept defending monthly highs. There is still a chance for a bearish correction ahead of US inflation data tomorrow. The bears should maintain control over the level of 1.0758. The mark has been repeatedly tested and is no longer as important as it used to be. So, a bearish correction is likely for as long as the pair trades below this range. Should EUR/USD rise in the course of the European session and fail to consolidate above 1.0758, a sell signal will be made with the target at the support level of 1.0722, which was repeatedly tested yesterday. The bullish moving averages also go there. A breakout and a retest will generate an additional sell signal targeting 1.0687, and pressure on the pair may increase. In case of consolidation below the range, the price will plunge to 1.0653, and the market will turn bearish. The most distant target stands at 1.0618 where it is wiser to lock in profit. If EUR/USD goes up in the course of the European session and there is a lack of bullish activity at 1.0758, short positions could be opened after a false breakout through 1.0791. EUR/USD could be sold on a rebound from 1.0820, allowing a bearish correction of 30 to 35 pips intraday.
Commitments of Traders:
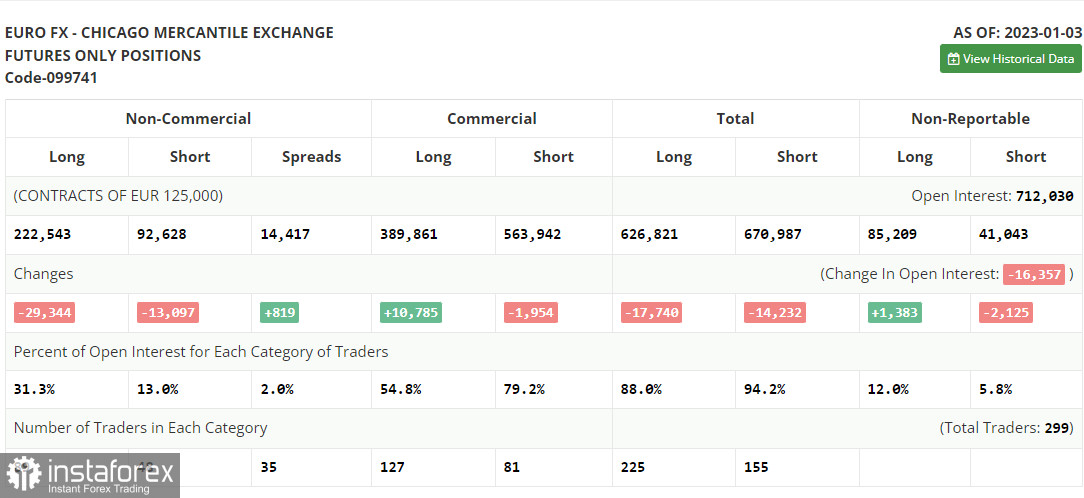
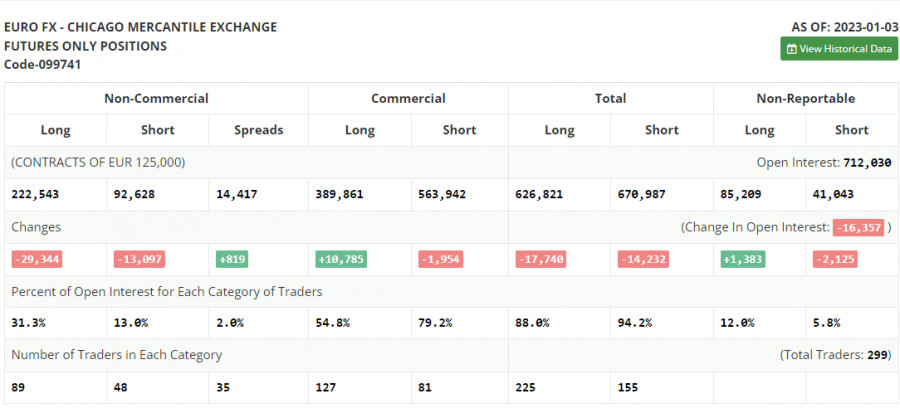
The COT report for January 3 logged a plunge in long and short positions. Traders preferred to lock in profits at the beginning of the year due to uncertainty surrounding the Fed's and the ECB's future monetary policy. Given that inflation is slowing down, it is now time to pause with aggressive measures. However, regulators have no such plans. That poses serious risks of a global recession this year. Therefore, demand for risk assets is now limited. US inflation data will be delivered soon. The outcome of the report is likely to determine the Fed's further monetary stance. According to the latest COT report, long non-commercial positions dropped by 29,344 to 222,543 and short non-commercial positions fell by 13,097 to 92,628. Consequently, the non-commercial net position came in at 129,915 versus 142,279 a week ago. Despite all that has been going on, investors are still buying the euro/dollar pair, hoping for less hawkish central banks. However, for a surge in price, new fundamental factors are needed. The weekly closing price decreased to 1.0617 from 1.0690.
Indicator signals:
Moving averages
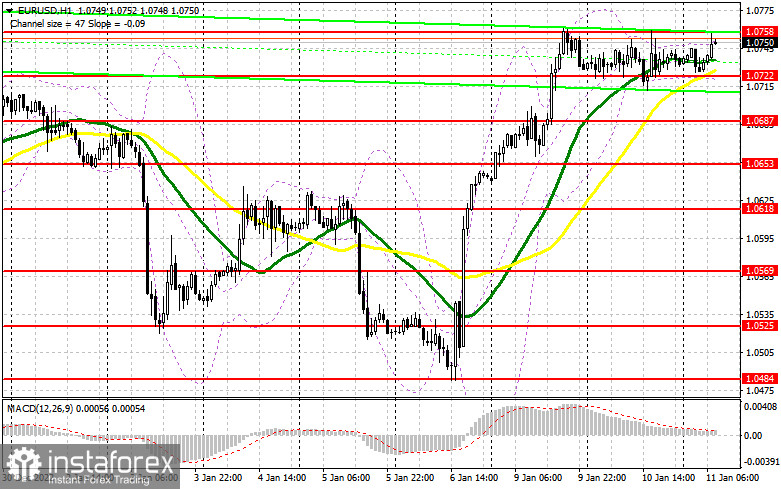
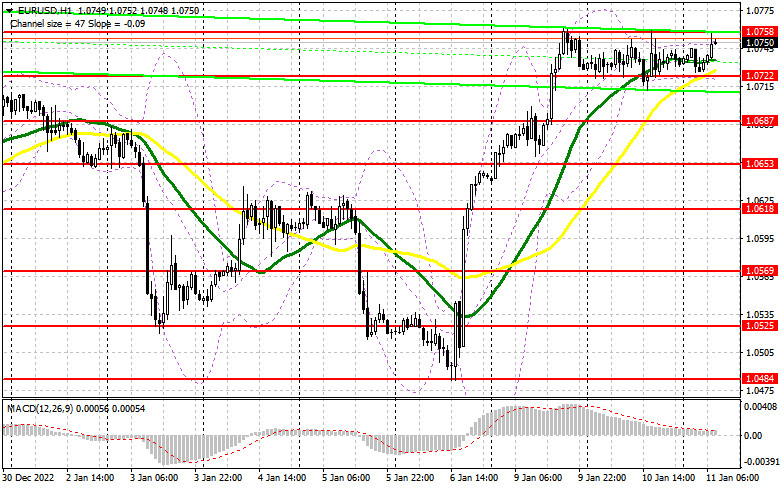
Trading is carried out above the 30-day and 50-day moving averages, indicating a shift in market sentiment.
Note: The period and prices of moving averages are viewed by the author on the hourly chart and differ from the general definition of classic daily moving averages on the daily chart.
Bollinger Bands
Resistance is seen at 1.0760, in line with the upper band. Support stands at 1.0722, in line with the lower band.
Indicator description:
- Moving average (MA) determines the current trend by smoothing volatility and noise. Period 50. Colored yellow on the chart.
- Moving average (MA) determines the current trend by smoothing volatility and noise. Period 30. Colored green on the chart.
- Moving Average Convergence/Divergence (MACD). Fast EMA 12. Slow EMA 26. SMA 9.
- Bollinger Bands. Period 20
- Non-commercial traders are speculators such as individual traders, hedge funds, and large institutions who use the futures market for speculative purposes and meet certain requirements.
- Long non-commercial positions are the total long position of non-commercial traders.
- Non-commercial short positions are the total short position of non-commercial traders.
- Total non-commercial net position is the difference between the short and long positions of non-commercial traders.