empty
 
 
04.10.2022 07:50 AM
Breaking forecast for EUR/USD on October 4, 2022

Thus, final data on the eurozone and the US manufacturing PMI slightly differed from preliminary estimates. In Europe, the final data was below the forecast, whereas in the US, it was ahead of projections. Thus, in the eurozone, the indicator should have increased to 49.6 points from 48.5 points, but it dropped by 48.4 points.

In the US, the manufacturing PMI advanced to 52.0 points from 51.5 points instead of rising to 51.8 points. Nevertheless, the euro was gaining in value, though very slowly. The climb was mainly triggered by the pound's appreciation caused by Liz Truss' refusal to cut taxes for the wealthy and her readiness to accept adjustments to the earlier offered plan.

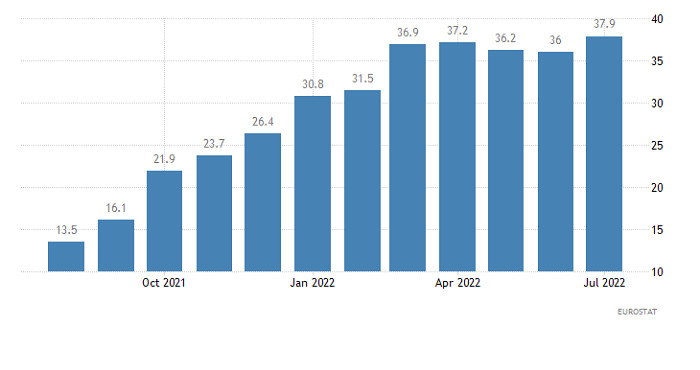
Today, the euro may grow thanks to the eurozone PPI figures, which may increase to 43.6% from 37.9%. The recent inflation data also unveiled a noticeable rise in consumer prices. It means that the PPI data will dispel all the doubts about a further rise in the key interest rate. The ECB has nothing to do but significantly tighten its monetary policy. In other words, interest rates will continue rising at least until next spring.

Meanwhile, the Federal Reserve will slacken its interest rates hike by the end of 2022. In the spring, it may even announce the first cut. As a result, in the foreseeable future, Europe's key interest rate will exceed the one in the US. Such a likelihood will boost the euro.

Eurozone PPI

This image is no longer relevant

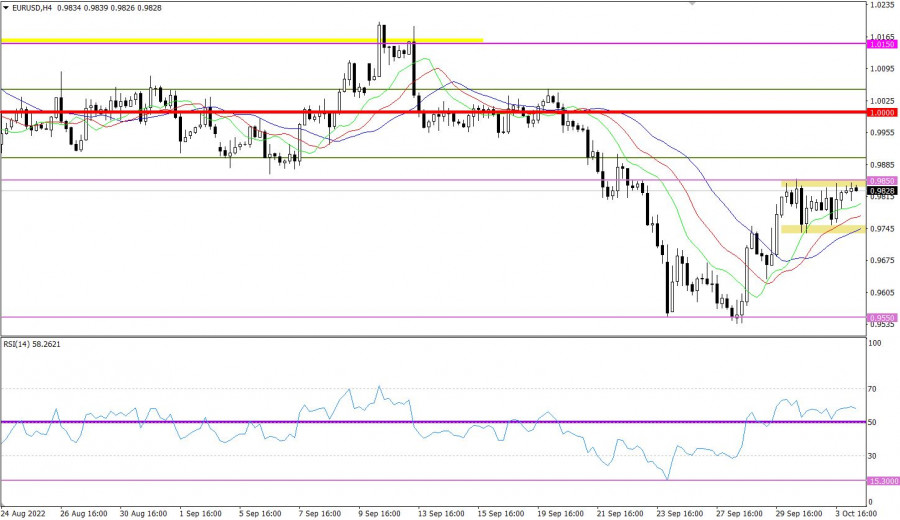
The euro/dollar pair reached the resistance level of 0.9850 amid the upward correction. After that, the volume of long positions dropped. As a result, the pair bounced and stagnated.

On the four-hour chart, the RSI technical indicator is hovering in the upper area of 50/70, which points to the fact that bullish sentiment prevails among traders. If the price upwardly intersects the 50 MA on the daily chart, the buy signal will become stronger.

On the four-hour chart, the Alligator's MAs are headed upwards, which also corresponds to the correctional movement. On the daily chart, the indicator is headed downwards, ignoring the correction.

This image is no longer relevant

Outlook

The price hovering within the range of 0.9750/0.9850 could be defined as a short-lived phenomenon, which may lead to the accumulation process. Under the current conditions, traders should wait for an outgoing impulse from either limit of the range.

In terms of the complex indicator analysis, we see that in the short-term and intraday periods, the indicator is providing a mixed signal because of the flat movement.

Dean Leo,
Chuyên gia phân tích của InstaForex
© 2007-2024
Kiếm lợi nhuận từ những biến đổi giá của tiền điện tử với InstaForex.
Tải MetaTrader 4 và mở giao dịch đầu tiên của bạn.
  • Grand Choice
    Contest by
    InstaForex
    InstaForex always strives to help you
    fulfill your biggest dreams.
    THAM GIA CUỘC THI
  • Tiền gửi lần truy cập
    Ký quỹ tài khoản của bạn với $3000 và nhận được $9000 nhiều hơn!
    Trong Tháng 5 chúng tôi xổ $9000 trong chiến dịch Chancy Deposit!
    Có được một cơ hội giành chiến thắng bằng việc ký quỹ $3000 vào một tài khoản giao dịch. Đáp ứng được điều kiện này, bạn trở thành một người tham gia chiến dịch.
    THAM GIA CUỘC THI
  • Giao dịch khôn ngoan, thành công
    Nạp tiền vào tài khoản của bạn với ít nhất $ 500, đăng ký cuộc thi và có cơ hội giành được các thiết bị di động.
    THAM GIA CUỘC THI
  • 100% tiền thưởng
    Cơ hội duy nhất của bạn để nhận 100% tiền thưởng khi gửi tiền
    NHẬN THƯỞNG
  • 55% Tiền thưởng
    Đăng ký tiền thưởng 55% cho mỗi lần gửi tiền của bạn
    NHẬN THƯỞNG
  • 30% tiền thưởng
    Nhận 30% tiền thưởng mỗi khi bạn nạp tiền vào tài khoản của mình
    NHẬN THƯỞNG

Các bài báo được đề xuất

Không thể nói chuyện ngay bây giờ?
Đặt câu hỏi của bạn trong phần trò chuyện.
Widget callback