To open long positions on EUR/USD, we need the following conditions:
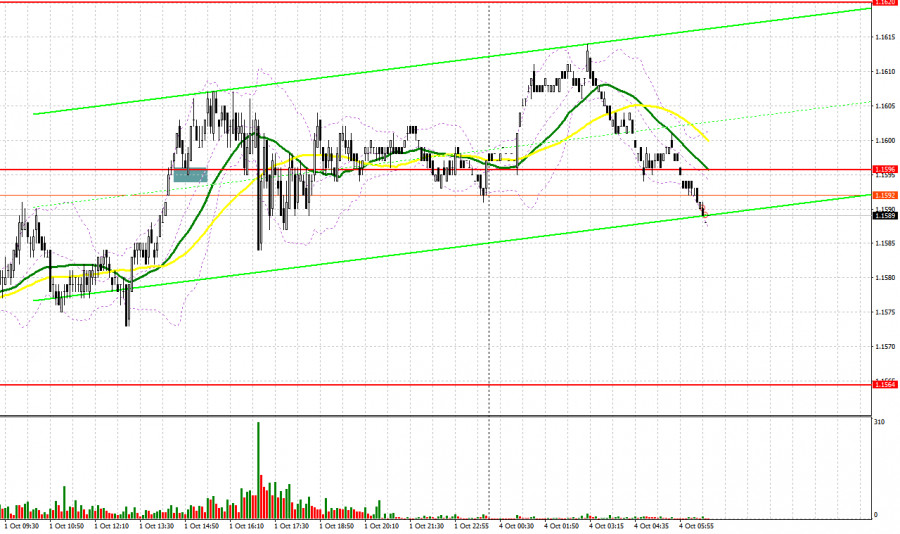
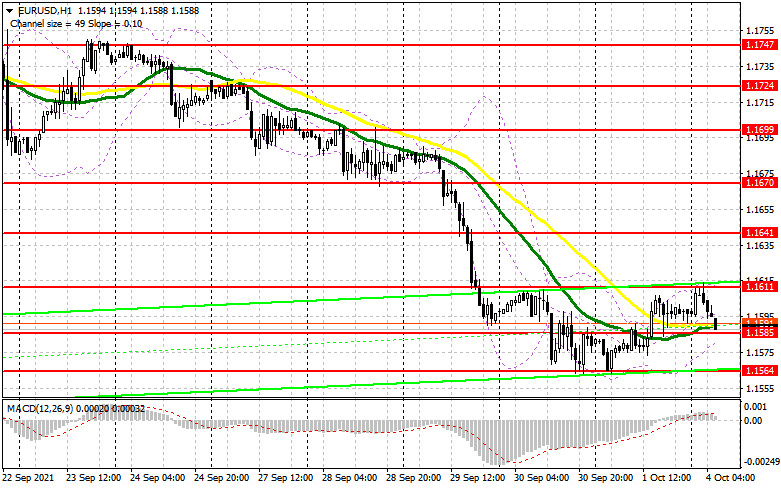
Bulls' attempts to push the pair higher turned out to be quite successful. On the 5M chart, in the first half of the day, the pair was trading mainly sideways. There were no entry points. Only in the New York session, it broke through the resistance level of 1.1596 amid strong inflation data for the eurozone. Shortly after, it tested this level once again, which led to the formation of a signal to open long positions. Yet, the quote was unable to rise higher due to US dismal data in the afternoon. Today, the macroeconomic calendar is empty. Investors may also ignore the report on the Sentix investor confidence index for the eurozone. The reading is expected to grow. Traders will be more focused on the meeting of the Eurogroup, which will be held today. They have no clue what issues will be discussed at the meeting. Nevertheless, the results of the meeting may affect market sentiment. During the European session, bulls need to hold the price at the support level of 1.1585. It was formed on Friday. Now, it acts as the middle of the sideways channel. A strong upward correction may continue from this level today. So, it is recommended to pay attention to this level. Only the formation of a false breakout may give a signal to open long positions amid possible upward correction to the resistance level of 1.1611. If this level is broken and EU data turns out to be positive, an entry point for long positions is likely to appear, which may push the pair to 1.1641. A more distant target will be the 1.1670 level. At this level, it is better to lock into profits. If bulls fail to push the price to the level of 1.1585, where the moving averages are located, it is recommended to consider long positions at the weekly low of 1.1564. It would be a wise decision to open long positions immediately after a rebound to the support level of 1.1538 and 1.1510, counting on an upward correction of 15-20 pips within a day.

To open short positions on EUR/USD, we need the following conditions:
Bears are now losing steam despite their fierce attempts to gain control. Bulls need to ensure the price consolidation at the upper border of the 1.1611 sideways channel in the first half of the day. The further upward correction of the pair depends on this level. There are no serious reasons for increasing long positions on the US dollar yet. Bulls may try to send the pair above 1.1611. Only the formation of a false breakout at this level in the first half of the day may give bears some strength. If so, the pair may reach the middle of the 1.1585 sideways channel. Bears need to return the price to the previous level to ensure a further fall of the euro. Only a breakout of the 1.1585 level will form a new entry point for short positions. In this case, the EUR/USD pair will decline to 1.1564. A test of this level amid weak eurozone data will indicate a resumption of the downward movement. A breakout of 1.1564 will push EUR/USD even lower to 1.1538. A more distant target will be the low of 1.1510, where it is recommended to fix profit. If bears fail to send the price to the level of 1.1611, it is best to postpone short trades until the test of a larger resistance level of 1.1641. It is better to open short positions immediately after a rebound based on a downward correction of 15-20 pips from the new high of 1.1670.

COT report:
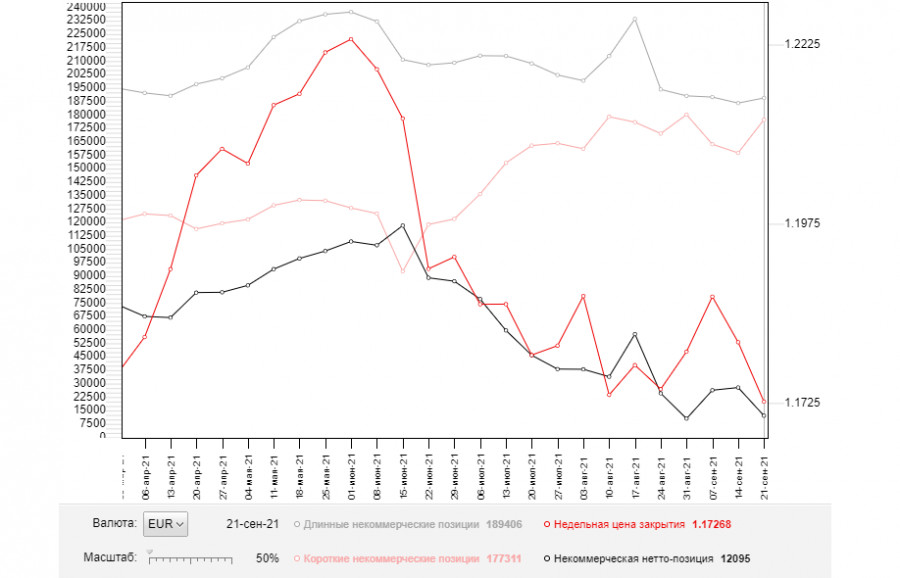
The COT report (Commitment of Traders) for September 21 showed a sharp increase in short positions and only a slight rise in long ones due to risk aversion at the beginning of autumn this year. The US dollar is strong amid expectations of changes in the Fed's monetary policy in November. Many investors believe that the central bank may begin reducing the bond purchases at this time. Inflation in the country remains high. So, the Fed may take more aggressive actions by the end of the year to cap the inflation growth. If so, it may affect market sentiment. This week, several Fed members and Fed Chairman Jerome Powell are going to deliver a speech. Their comments may shed light on how the central bank will act in the near future. Given that energy prices are soaring, which will inevitably affect the producer and consumer price index, investors are awaiting these speeches with bated breath. Demand for risky assets will remain subdued due to the high probability of a new wave of coronavirus and its new Delta strain. The European Central Bank is likely to stick to a wait-and-see position amid such a situation. In addition, it will maintain asset purchases at the current pace as inflation in the eurozone is under control. The COT report showed that long non-commercial positions grew to 189,406 from 186,554, while short non-commercial positions jumped to 177,311 from 158,749. At the end of the week, the total non-commercial net position dropped to 12,095 from 27,805. The weekly closing price also dropped to 1.1726 from 1.1809.

Indicator signals:
Moving Averages:
Trading is conducted above the 30 and 50 moving averages, which indicates bulls' attempts to take the upper hand.
Note: The periods and prices of moving averages viewed by the author of the article on the H1 chart differ from the general definition of the classic daily moving averages on the D1 chart.
Bollinger Bands
A breakout of the upper limit of the indicator in the area of 1.1611 will trigger a rise in the euro. A breakout of the lower limit of 1.1585 will exert pressure on the pair.
Description of indicators
A moving average helps smooth out price action by filtering out the noise from random price fluctuations. Period 50. It is marked in yellow on the chart.
A moving average helps smooth out price action by filtering out the noise from random price fluctuations. Period 30. It is marked in green on the chart.
MACD indicator (Moving Average Convergence/Divergence - convergence/divergence of moving averages) Fast EMA period 12. Slow EMA period 26. SMA period 9
Bollinger Bands. Period 20
Non-commercial traders are individual traders, hedge funds, and large institutions that use the futures market for speculative trading with certain requirements.
Long non-commercial positions represent the total number of long position of non-commercial traders.
Short non-commercial positions represent the total number of short position of non-commercial traders.
Non-commercial net position is the difference between the short and long positions of non-commercial traders.


