Analysis of Friday's Trades:
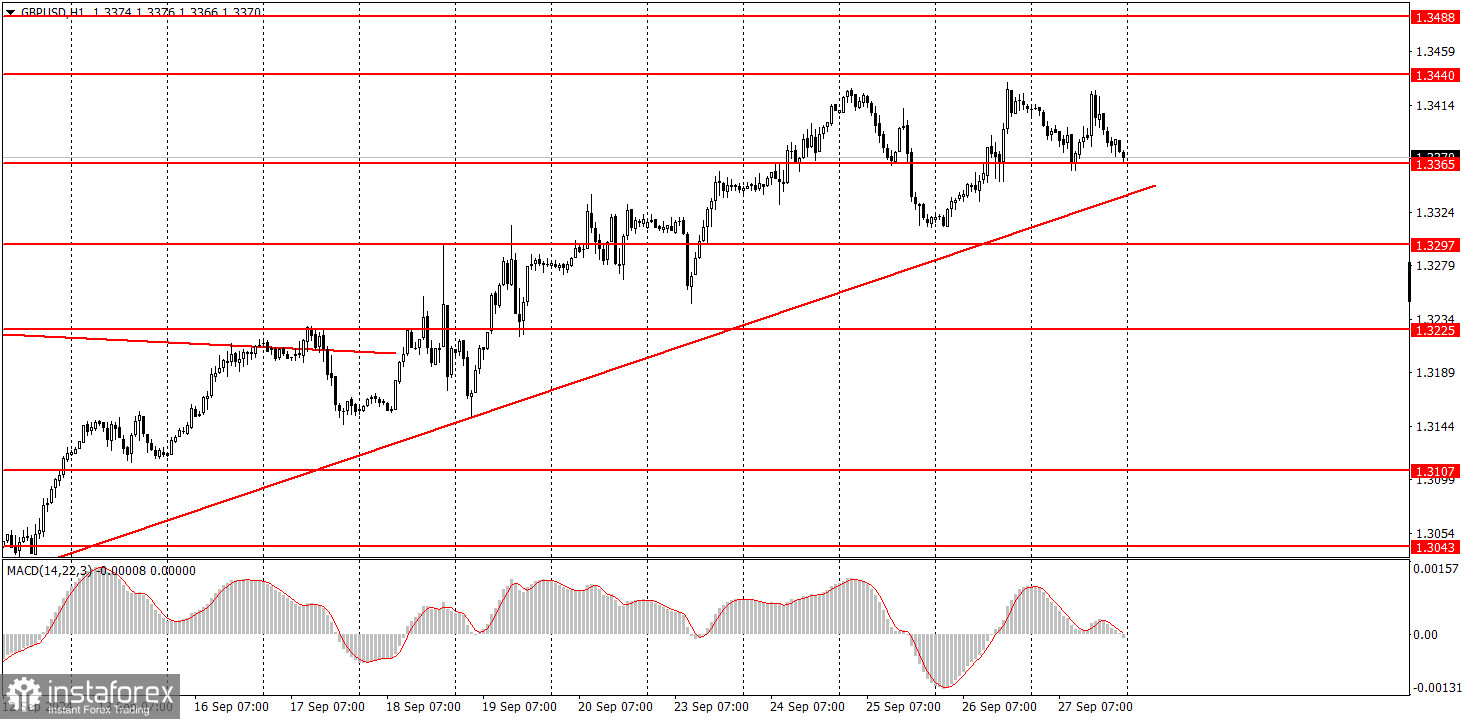
GBP/USD on 1H Chart
The GBP/USD pair made a slight downward correction on Friday, but it's more accurate to say it "pulled back" rather than "corrected." The difference between a "correction" and a "pullback" is that a correction is more substantial and lasts longer. We are still in a clear local uptrend and haven't seen downward movements exceeding 80-100 pips in a long time. On Thursday, the US currency fell by another 100 pips, even though the GDP and durable goods orders reports were stronger than expected, and Federal Reserve Chair Jerome Powell didn't share anything significant in his speech. On Friday, the market took a small break. Incidentally, the US macroeconomic data once again provided no reasons to sell the dollar. The Personal Consumption Expenditures (PCE) price index rose to 2.7% year-on-year, indicating an increase in inflation, which the Fed closely monitors, and the Consumer Sentiment Index was stronger than expected in September.
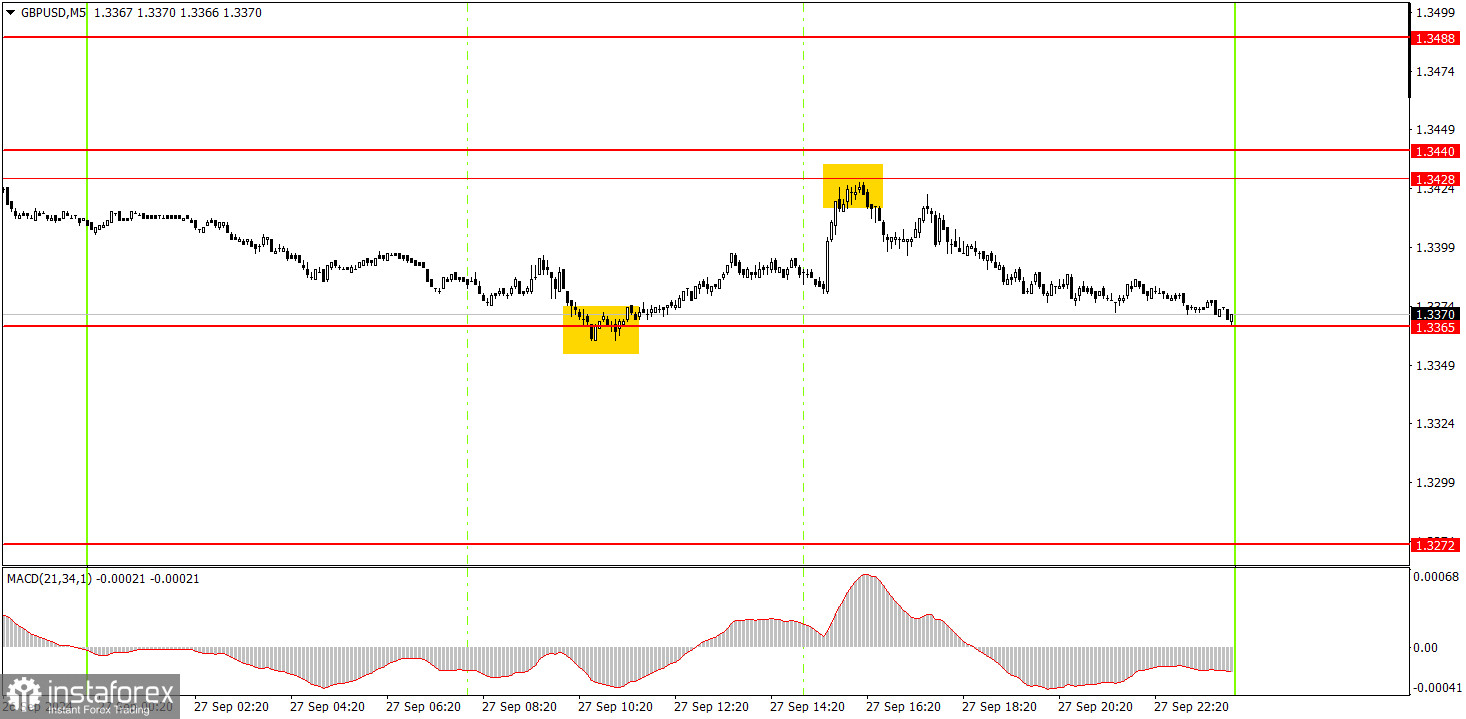
GBP/USD on 5M Chart
Two trading signals were formed in the 5-minute time frame on Friday. First, the pair bounced off the 1.3365 level, then rose to 1.3428 and bounced off this level. By the end of the day, it returned to 1.3365. Thus, novice traders could first open a long position and then a short one. The first trade brought them about 40 pips of profit, and the second one brought the same amount.
How to Trade on Monday:
In the hourly time frame, the GBP/USD pair is moving upward again despite no new reasons. There are currently no issues with volatility, so at least traders can open trades within each day instead of just watching the tiny movements that could be described as "convulsions." However, there are still significant problems with the logic of these movements. We continue to see the pair rise even when all factors favor the dollar. Corrections are minimal or nonexistent.
On Monday, the British pound may attempt to resume its upward movement again, as it certainly doesn't need any factors to do so. Trading on Monday can be done from the 1.3365 level.
In the 5-minute time frame, trading can now be done at the following levels: 1.2913, 1.2980-1.2993, 1.3043, 1.3102-1.3107, 1.3145-1.3167, 1.3225, 1.3272, 1.3365, 1.3428-1.3440, 1.3488, 1.3537. On Monday, the UK will release its GDP report, projected to be 0.6%. Powell will give a speech in the US, which could once again cause problems for the US currency, regardless of what Powell communicates to the market.
Basic Rules of the Trading System:
1) Signal Strength: The strength of a signal is determined by the time it takes to form (bounce or break through a level). The less time it takes, the stronger the signal.
2) False Signals: If two or more trades are opened near a certain level based on false signals, all subsequent signals from that level should be ignored.
3) Flat Market: In a flat market, any pair can generate numerous false signals or none at all. In any case, it's better to stop trading at the first signs of a flat market.
4) Trading Timeframe: Trades should be opened between the start of the European session and the middle of the American session, after which they should be closed manually.
5) MACD Indicator Signals: In the hourly time frame, it is preferable to trade based on MACD signals only when there is good volatility and a trend confirmed by a trendline or trend channel.
6) Close Levels: If two levels are located too close to each other (between 5 and 20 pips), they should be considered as a single support or resistance area.
7) Stop Loss: Once the price moves 20 pips in the intended direction, a Stop Loss should be set at the breakeven point.
What's on the Charts:
Support and Resistance Price Levels: These levels serve as targets when opening buy or sell positions. They can also be used as points to set Take Profit levels.
Red Lines: These represent channels or trend lines that display the current trend and indicate the preferred trading direction.
MACD Indicator (14,22,3): The histogram and signal line serve as an auxiliary indicator that can also be used as a source of trading signals.
Important Speeches and Reports (always found in the news calendar) can significantly impact the movement of a currency pair. Therefore, trading should be done with maximum caution during their release, or you may choose to exit the market to avoid a sharp price reversal against the preceding movement.
For Beginners Trading on the Forex Market: It's essential to remember that not every trade will be profitable. Developing a clear strategy and practicing money management is key to achieving long-term success in trading.