Analyzing Friday's Trades:
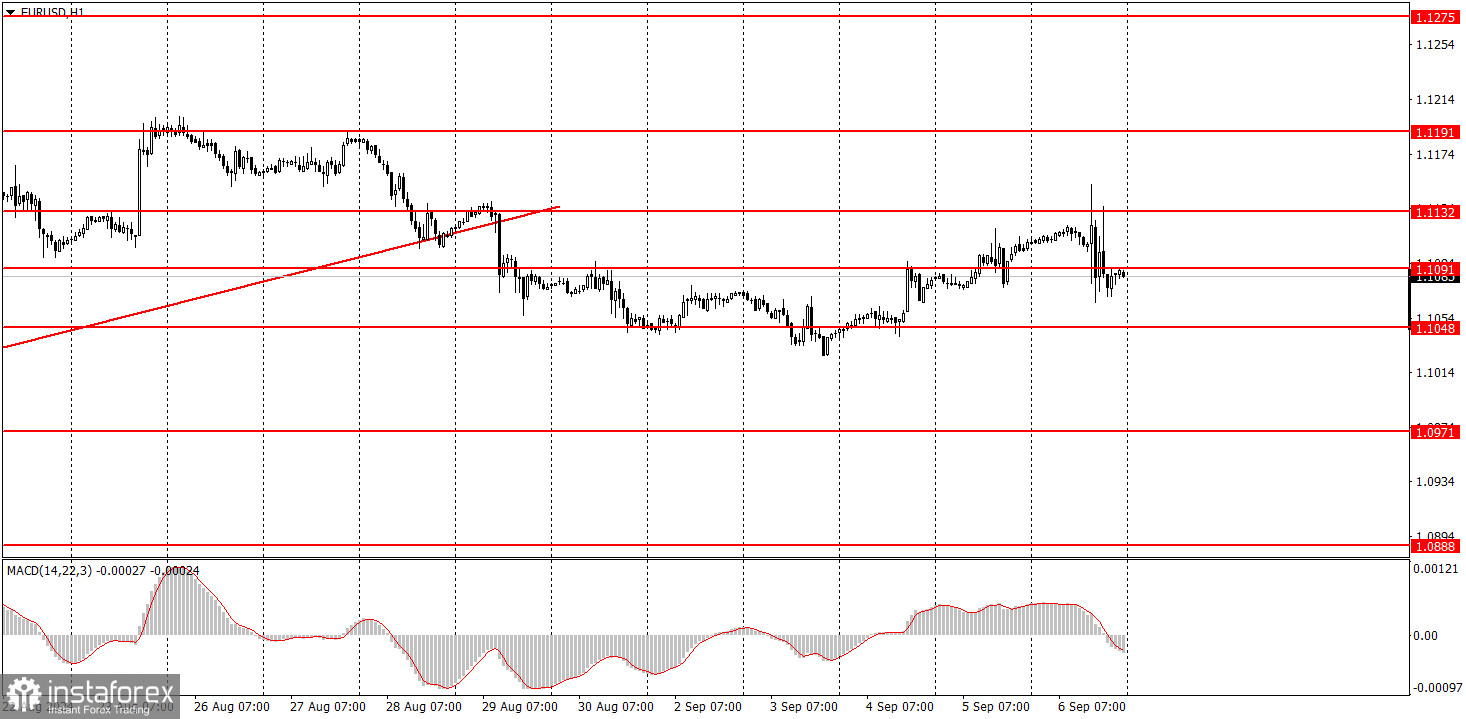
EUR/USD on 1H Chart
The EUR/USD pair on Friday probably showed a typical movement. The price remained stagnant throughout the European trading session, and then, at the beginning of the U.S. session, an emotional outburst was quite expected. At that time, the U.S. published NonFarm Payrolls, unemployment levels, and average earnings reports. It's difficult to interpret these reports unambiguously because the unemployment rate decreased but within the forecast; the number of NonFarms was below forecasts, but only slightly and was higher than the previous value; wages accelerated, which somewhat reduces the likelihood of aggressive easing of monetary policy by the Federal Reserve. The market assessed these data as "conditionally positive," and the dollar slightly rose. However, these reports do not open up any notable prospects for the dollar. Labor market and unemployment data still leave much to be desired, forcing the Fed to lower the key rate at least once or twice. The market has long priced in these "once or twice," but it continues to anticipate a much more aggressive monetary policy easing.
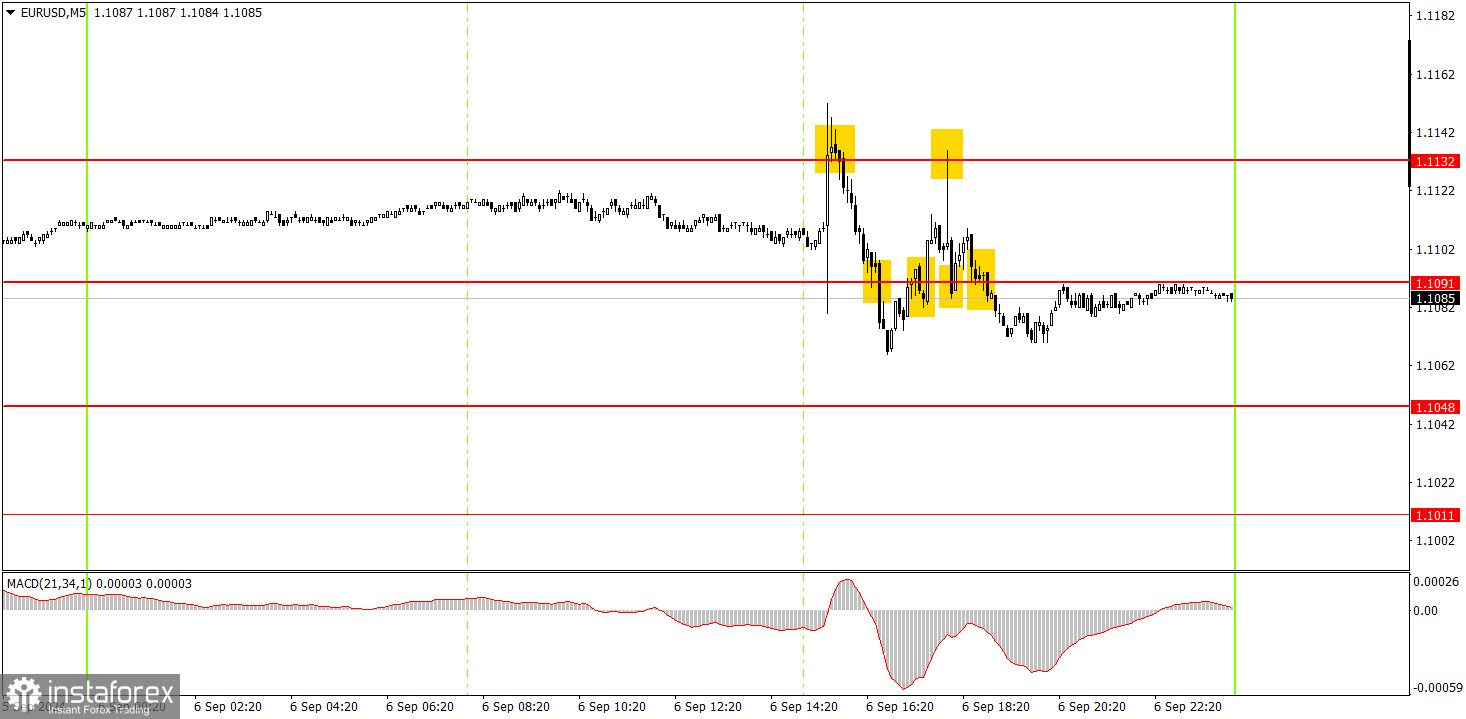
EUR/USD on 5M Chart
In the 5-minute time frame on Friday, there was initially a total flat, then turbulence. During the U.S. trading session, novice traders could only work on two sell signals near the level of 1.1132, as they were the most accurate. However, the impact of the macroeconomic background was very strong, so the level of 1.1132 might have been surpassed. Four trading signals were formed at once near the level of 1.1091, but all were inaccurate and contradictory.
How to Trade on Monday:
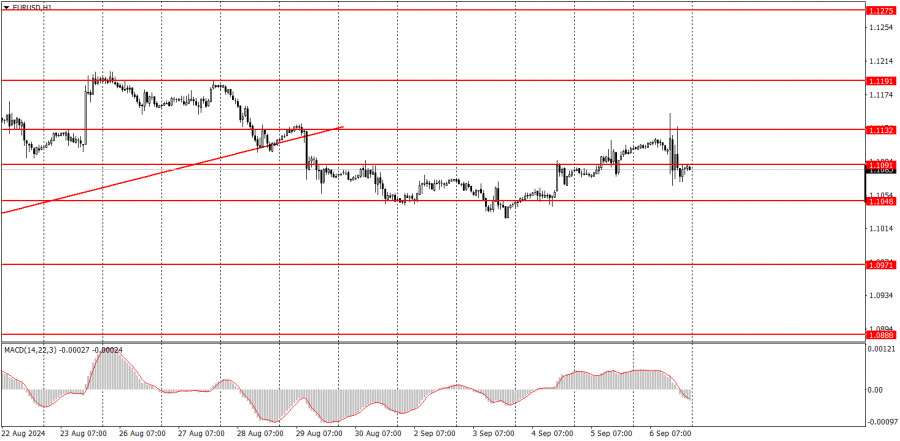
In the hourly time frame, the EUR/USD pair has consolidated below the ascending trend line and, for the first time in a long while, has a chance to form a downward trend that would be logical and consistent with all factors and types of analysis. Unfortunately, illogical dollar sales could quickly resume after a downward correction, as no one knows how long the market will continue to price in the Fed's monetary policy easing, which has yet to start. The market continues to price in almost all future rate cuts by the Fed, and U.S. macroeconomic data often disappoint rather than please.
On Monday, novice traders can expect movements in any direction. Although the downtrend persists, the latest U.S. labor market data were more disappointing than pleasing.
The key levels to consider on the 5M time frame are 1.0726-1.0733, 1.0797-1.0804, 1.0838-1.0856, 1.0888-1.0896, 1.0940, 1.0971, 1.1011, 1.1048, 1.1091, 1.1132, 1.1191, 1.1275-1.1292. No significant events or reports are scheduled for Monday in the Eurozone or the U.S. Therefore, volatility may be low again, and movements predominantly flat.
Basic Rules of the Trading System:
1) The strength of a signal is determined by the time it takes for the signal to form (bounce or level breakthrough). The less time it took, the stronger the signal.
2) If two or more trades were opened around any level due to false signals, subsequent signals from that level should be ignored.
3) In a flat market, any currency pair can form multiple false signals or none at all. In any case, it's better to stop trading at the first signs of a flat market.
4) Trades should be opened between the start of the European session and midway through the U.S. session. After this period, all trades must be closed manually.
5) In the hourly time frame, trades based on MACD signals are only advisable amidst good volatility and a trend confirmed by a trendline or trend channel.
6) If two levels are too close to each other (5 to 20 pips), they should be considered a support or resistance area.
7) After moving 15 pips in the intended direction, the Stop Loss should be set to break even.
What's on the Charts:
Support and Resistance price levels: targets for opening long or short positions. You can place Take Profit levels around them.
Red lines: channels or trend lines that depict the current trend and indicate the preferred trading direction.
The MACD indicator (14,22,3): encompassing both the histogram and signal line, acts as an auxiliary tool and can also be used as a source of signals.
Important speeches and reports (always noted in the news calendar) can profoundly influence the movement of a currency pair. Hence, trading during their release calls for heightened caution. It may be reasonable to exit the market to avoid sharp price reversals against the prevailing movement.
For beginners, it's important to remember that not every trade will yield profit. Developing a clear strategy and effective money management is key to success in trading over the long term.