Analyzing Thursday's trades:
EUR/USD on 1H chart
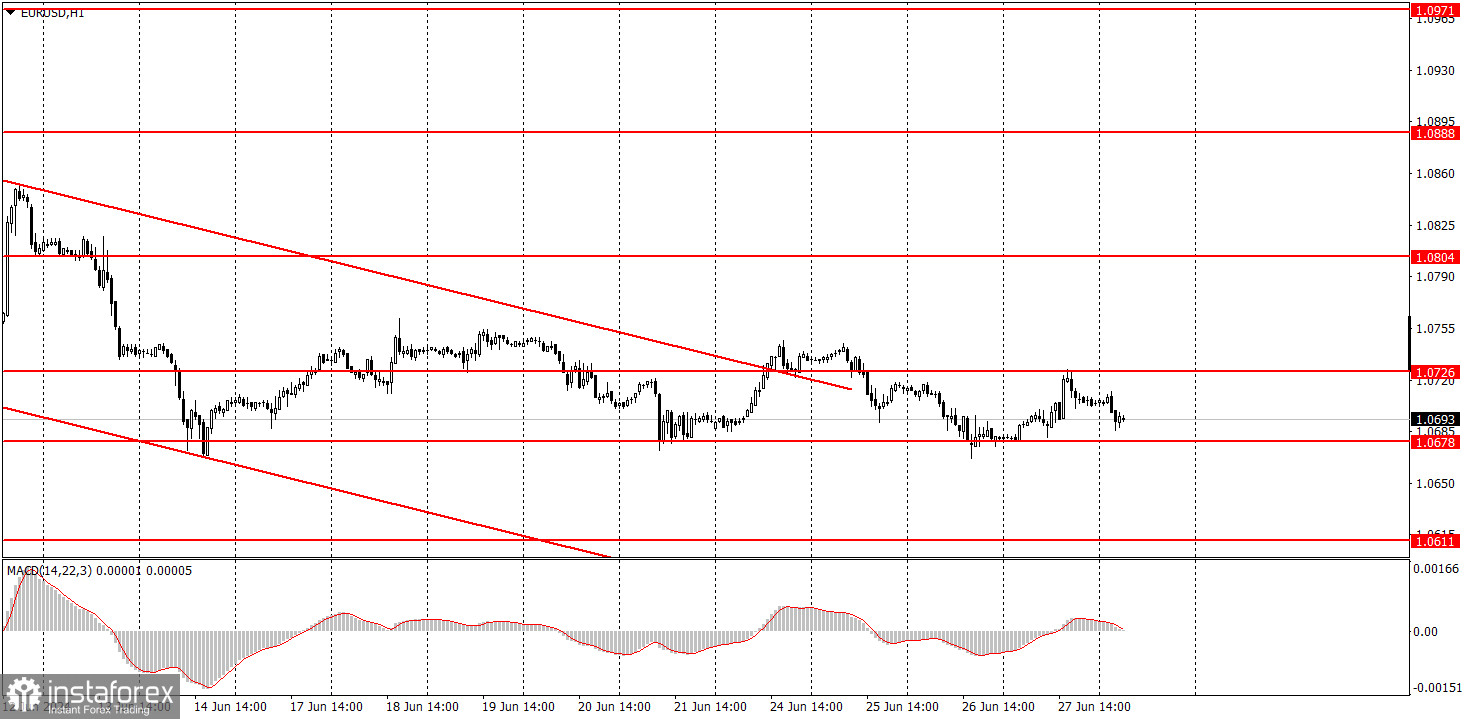
Yesterday, EUR/USD demonstrated movements that fully comply with the current technical picture. Let's take a closer look. The pair has been experiencing sideways movement for two weeks, maintaining a downward trend. It has failed to consolidate below the 1.0678 level after three attempts. However, each bounce leads to an even smaller pullback to the upside. Volatility is low, but that's no longer surprising. Thus, it seems that the price will likely breach the 1.0678 level on the fourth or fifth attempt, and the euro will continue to fall.
Yesterday, the US released some notable reports on GDP and durable goods. GDP matched expert forecasts at 1.4%, and orders for durable goods for May showed a greater increase than expected. However, the value for April was revised downwards. Therefore, we can say that the US macro data turned out to be slightly worse than forecasts, which exerted some pressure on the dollar.
EUR/USD on 5M chart
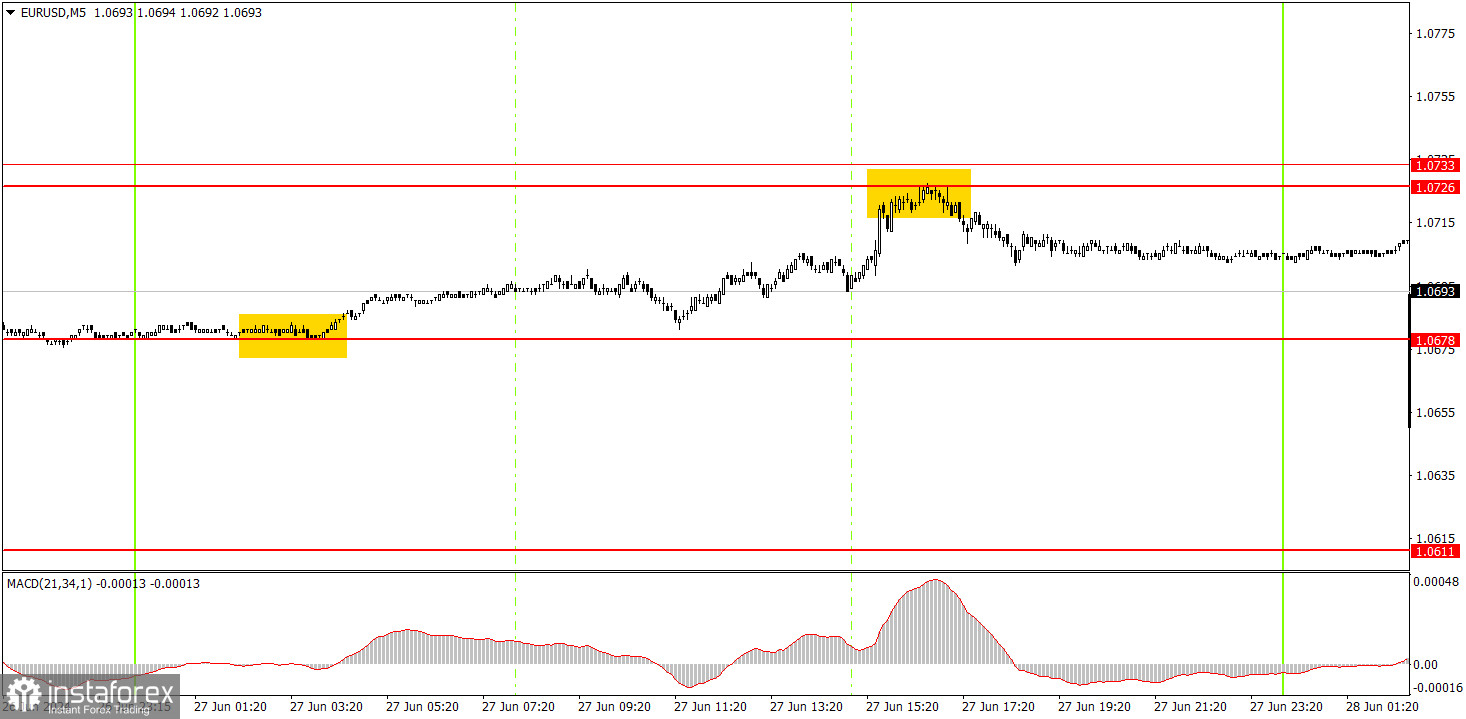
Two perfect technical signals were formed on the 5-minute timeframe. During the Asian trading session, the price bounced off the 1.0678 level, and during the US session, it bounced off the 1.0726 level. In the first case, beginners could open long positions, and short positions in the second. Since Thursday's volatility was 50 pips, high profits were inherently impossible. The first trade yielded about 20 pips, and the second even less.
Trading tips on Friday:
On the hourly chart, EUR/USD has shifted to forming a local downward trend, but the pair is currently going through a correction and trading within a horizontal channel. We still expect the pair to drop to levels like 1.0600, 1.0450, and even 1.0200. However, it's important to understand that the price will not reach these targets immediately; they are medium-term objectives. For instance, the pair could go through a corrective phase for another week, as the price has not breached the level of 1.0678 even after three attempts. Nonetheless, we don't see any reasons for the euro to rise in the medium-term.
On Friday, traders can expect the downward movement to continue if the price breaks through the level of 1.0678. However, it's important to remember that EUR/USD may show weak and erratic movements.
The key levels on the 5M chart are 1.0483, 1.0526, 1.0568, 1.0611, 1.0678, 1.0726-1.0733, 1.0797-1.0804, 1.0838-1.0856, 1.0888-1.0896, 1.0940, 1.0971-1.0981. No significant events are scheduled in the Eurozone, while the US will post four reports, two of which are moderately important. We believe that traders should focus on the PCE index and the University of Michigan consumer sentiment index.
Basic trading rules:
1) Signal strength is determined by the time taken for its formation (either a bounce or level breach). A shorter formation time indicates a stronger signal.
2) If two or more trades around a certain level are initiated based on false signals, subsequent signals from that level should be disregarded.
3) In a flat market, any currency pair can produce multiple false signals or none at all. In any case, the flat trend is not the best condition for trading.
4) Trading activities are confined between the onset of the European session and mid-way through the U.S. session, after which all open trades should be manually closed.
5) On the 30-minute timeframe, trades based on MACD signals are only advisable amidst substantial volatility and an established trend, confirmed either by a trendline or trend channel.
6) If two levels lie closely together (ranging from 5 to 15 pips apart), they should be considered as a support or resistance zone.
How to read charts:
Support and Resistance price levels can serve as targets when buying or selling. You can place Take Profit levels near them.
Red lines represent channels or trend lines, depicting the current market trend and indicating the preferable trading direction.
The MACD(14,22,3) indicator, encompassing both the histogram and signal line, acts as an auxiliary tool and can also be used as a signal source.
Significant speeches and reports (always noted in the news calendar) can profoundly influence the price dynamics. Hence, trading during their release calls for heightened caution. It may be reasonable to exit the market to prevent abrupt price reversals against the prevailing trend.
Beginners should always remember that not every trade will yield profit. Establishing a clear strategy coupled with sound money management is the cornerstone of sustained trading success.