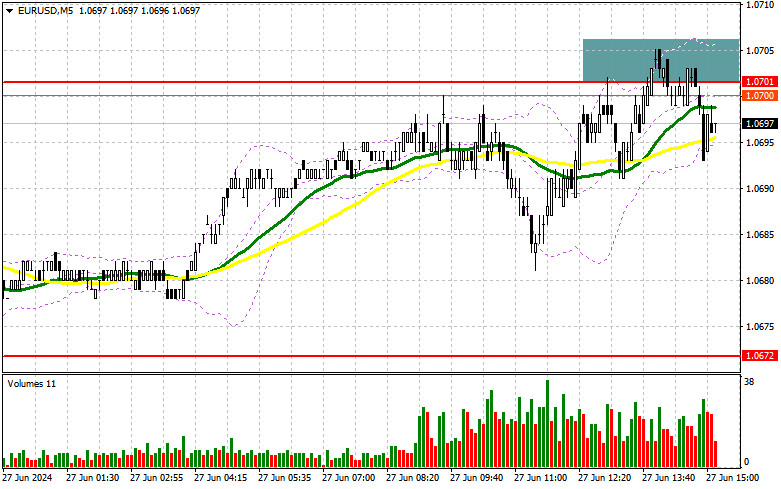
In my morning forecast, I focused on the 1.0701 level and planned to make trading decisions based on it. Let's look at the 5-minute chart and see what happened there. The rise and the formation of a false breakout at 1.0701 led to a sell signal, resulting in a decline of the pair by only 10 points, after which the pressure on the euro eased. However, buyers did not manifest themselves either. The technical picture was slightly revised for the second half of the day.
To Open Long Positions on EURUSD:
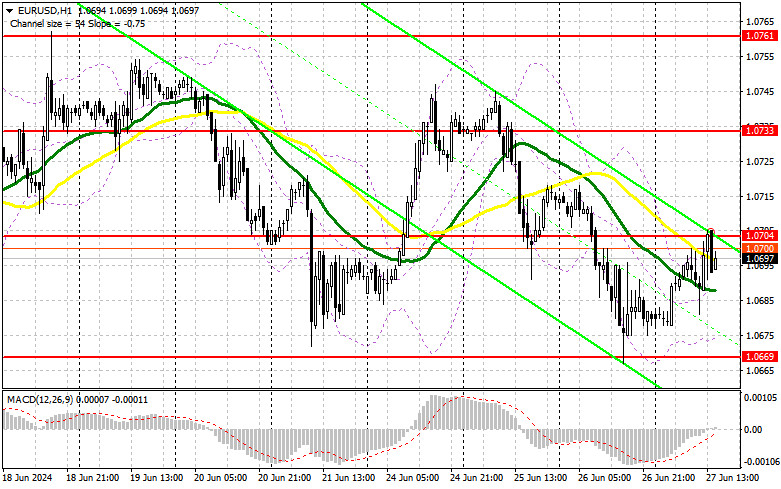
Data from the Eurozone mostly matched economists' expectations, which affected market volatility. There is no significant demand for risk assets and no reason for it either. In the second half of the day, data on the change in GDP volume for the 1st quarter and the number of initial jobless claims in the US can shift the balance of power, as can the figures on durable goods orders and the trade balance. However, I prefer to act on declines and after a false breakout around 1.0669 – the support formed by yesterday's results. This will become a suitable entry point for long positions to update 1.0704 – the resistance that performed well this morning. Slightly above this level are the moving averages, which favor the sellers, so a breakout and update from top to bottom of this range will strengthen the pair with a chance to rise toward 1.0733. The furthest target will be the maximum at 1.0761, where I will be taking a profit. Testing this level will give buyers an advantage. In the case of a decline in EUR/USD and a lack of activity around 1.0669 in the second half of the day, sellers will take control of the market, moving out of the sideways channel. In this case, I will enter only after forming a false breakout around the next support at 1.0642. I plan to open long positions immediately on a rebound from 1.0601 with the aim of an upward correction of 30-35 points within the day.
To Open Short Positions on EURUSD:
Sellers have shown themselves and performed quite well, and now it is crucial to stay below 1.0704. In the event of a bullish market reaction to the US data, defending the resistance at 1.0704 and a false breakout there will provide a suitable entry point for short positions, aiming for further decline towards the support at 1.0669, which serves as the lower boundary of the sideways channel. A breakout and consolidation below this range, along with a retest from bottom to top, will give another point for selling, moving towards the new low at 1.0642, where I expect to see more active buying. The furthest target will be the minimum at 1.0601, where I will take profit. In the case of an upward movement in EUR/USD in the second half of the day, and also if bears are absent at 1.0704, which is more likely, buyers will manage to restore balance to the market, keeping trading within the channel. In this case, I will postpone selling until testing the next resistance at 1.0733. I will also sell there, but only after an unsuccessful consolidation. I plan to open short positions immediately on a rebound from 1.0761, aiming for a downward correction of 30-35 points.

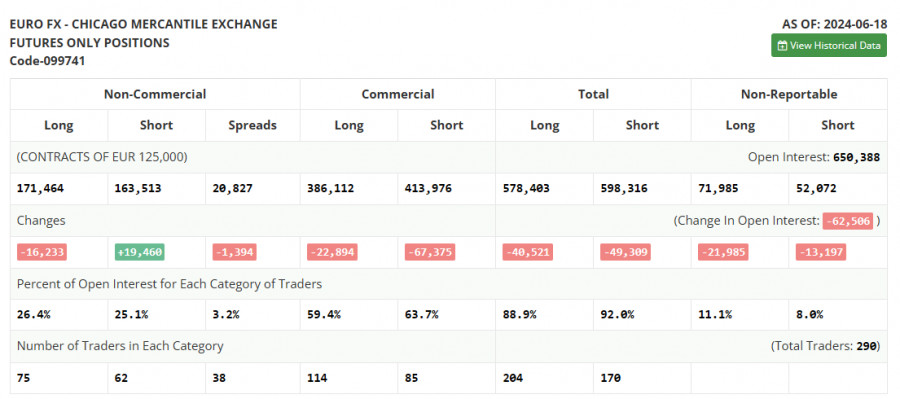
The COT report (Commitment of Traders) for June 18 showed an increase in short positions and a decrease in long positions. The outcomes of the Federal Reserve and European Central Bank meetings significantly impacted the market dynamics. The total number of short and long positions also confirms the current balance observed on the chart. Considering that no significant statistics are expected in the near future, this equilibrium is likely to persist. However, it should be understood that the overall trend and bearish direction of EUR/USD have not disappeared, and the euro's decline could resume any moment. According to the COT report, non-commercial long positions decreased by 16,233 to 171,464, while non-commercial short positions increased by 19,460 to 163,513. As a result, the spread between long and short positions decreased by 1,394.
Indicator Signals:
Moving Averages
Trading is conducted below the 30 and 50-day moving averages, indicating a decline in the euro.
Note: The author considers the period and prices of the moving averages on the H1 hourly chart and differs from the general definition of classical daily moving averages on the D1 daily chart.
Bollinger Bands
In case of a decline, the lower boundary of the indicator, around 1.0669, will act as support.
Indicator Descriptions:
- Moving average: Determines the current trend by smoothing out volatility and noise. Period: 50. Marked in yellow on the chart.
- Moving average: Determines the current trend by smoothing out volatility and noise. Period: 30. Marked in green on the chart.
- MACD (Moving Average Convergence/Divergence): Fast EMA period: 12. Slow EMA period: 26. SMA period: 9.
- Bollinger Bands: Period: 20.
- Non-commercial traders are speculators, such as individual traders, hedge funds, and large institutions, who use the futures market for speculative purposes and meet certain requirements.
- Long non-commercial positions: Represent the total long open position of non-commercial traders.
- Short non-commercial positions: Represent the total short open position of non-commercial traders.
Total non-commercial net position: The difference between non-commercial traders' short and long positions.


