Analyzing Wednesday's trades:
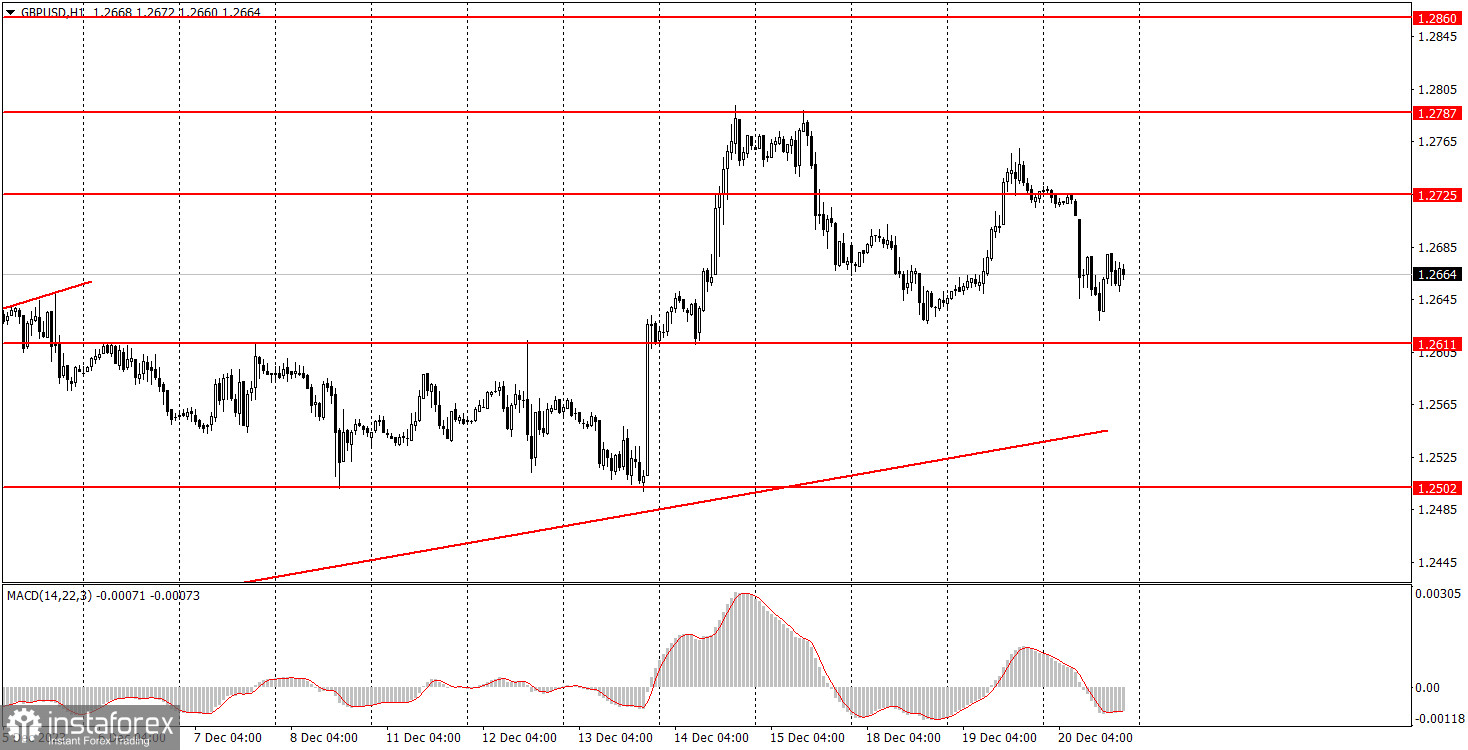
GBP/USD on 30M chart
GBP/USD faced strong negative pressure on Wednesday. We have repeatedly mentioned that the pound is more likely to experience a decline, as there are no fundamental and macroeconomic reasons to support its growth. Nevertheless, the economic reports on Wednesday exerted pressure on the pound. The UK released an inflation report in the morning, which indicated a more significant slowdown in November than traders and experts had anticipated. Clearly, with a faster decline in the Consumer Price Index, the Bank of England has fewer reasons to raise the key interest rate or keep it at its peak level for an extended period. For the British pound, the fewer hawkish factors, the worse. Therefore, it was logical for the pound to fall on Wednesday.
However, the pound did not fall so strongly as to indicate a new downtrend. The price still remains above the ascending trendline, indicating that the uptrend will persist. Consequently, from a technical perspective, it would be more probable for the pound to appreciate. However, macroeconomics and fundamentals continue to point towards a more likely decline in the pair.
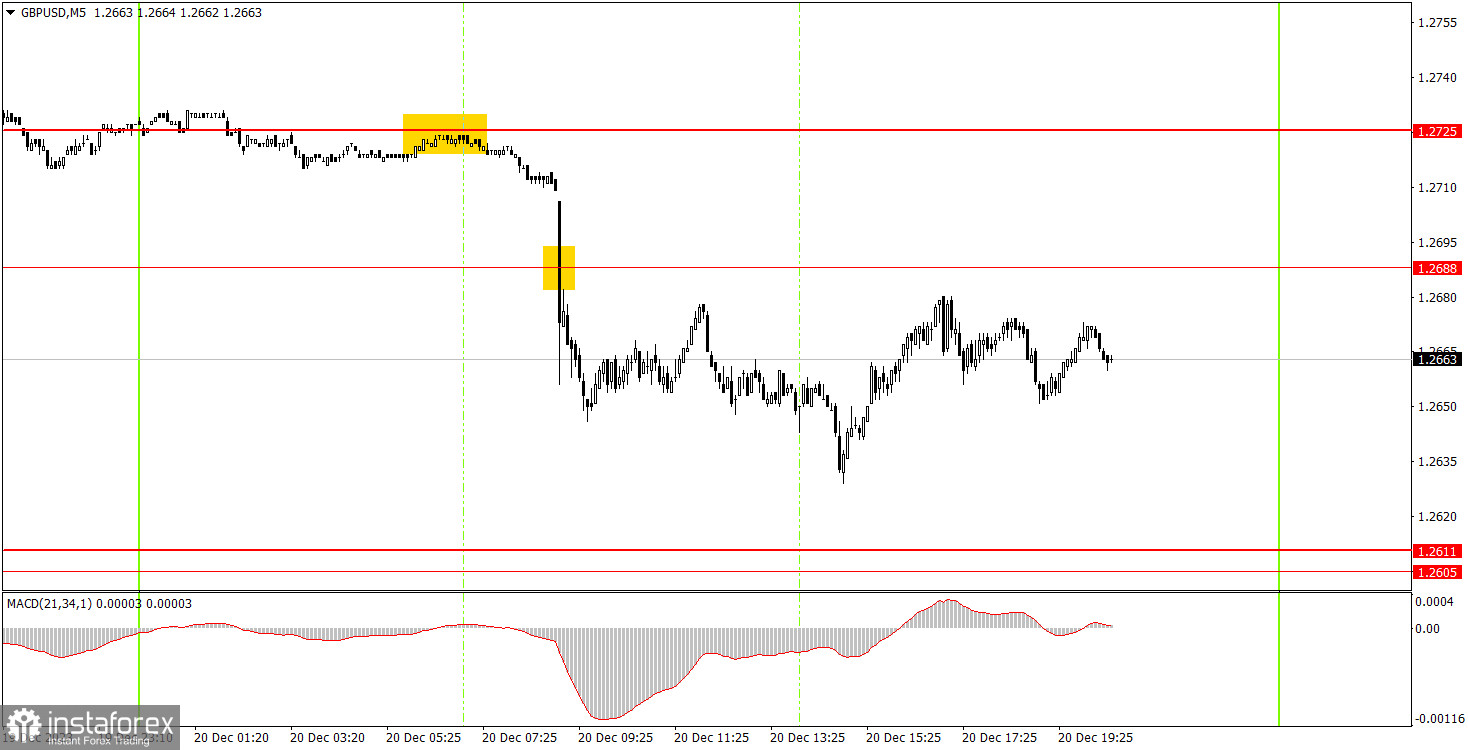
GBP/USD on 5M chart
On the 5-minute chart, two trading signals were generated. Initially, the pair rebounded from the level of 1.2725 and then surpassed the level of 1.2688. Therefore, beginners could enter the market around the level of 1.2725 and remain in short positions until the evening, when, according to the current trading system, it was time to close the trades. As no buy signals were formed during the day, there was no reason to close the short position. It could be manually closed in the evening, and the profit from it could be around 50 pips.
Trading tips on Thursday:
On the hourly chart, GBP/USD has resumed its uptrend, but it has been difficult to answer why the pair is moving this way. Last week, the British pound had specific reasons to rise, but it no longer has any of those this week. And it is unlikely that the pair will gain such reasons this week, so it would be logical for the pair to return to the 1.2502 level.
On Thursday, beginners may pay attention to the area of 1.2605-1.2611. There's a high probability that the price will return to it, as it has already reacted to it before. We can expect growth if the pair rebounds from this area, and we can use 1.2688 as a target for that. If the pair manages to surpass this area, we can expect it to fall and use 1.2544 as a target.
The key levels on the 5M chart are 1.2270, 1.2310, 1.2372-1.2387, 1.2457, 1.2502, 1.2544, 1.2605-1.2611, 1.2688, 1.2725, 1.2787-1.2791, 1.2848-1.2860, 1.2913. On Thursday, there will be no interesting events in the UK. The US docket will feature an important report on Q3 GDP, but the market may hardly react to it, as its value is unlikely to differ from the first and second estimates.
Basic trading rules:
1) Signal strength is determined by the time taken for its formation (either a bounce or level breach). A shorter formation time indicates a stronger signal.
2) If two or more trades around a certain level are initiated based on false signals, subsequent signals from that level should be disregarded.
3) In a flat market, any currency pair can produce multiple false signals or none at all. In any case, the flat trend is not the best condition for trading.
4) Trading activities are confined between the onset of the European session and mid-way through the U.S. session, after which all open trades should be manually closed.
5) On the 30-minute timeframe, trades based on MACD signals are only advisable amidst substantial volatility and an established trend, confirmed either by a trendline or trend channel.
6) If two levels lie closely together (ranging from 5 to 15 pips apart), they should be considered as a support or resistance zone.
How to read charts:
Support and Resistance price levels can serve as targets when buying or selling. You can place Take Profit levels near them.
Red lines represent channels or trend lines, depicting the current market trend and indicating the preferable trading direction.
The MACD(14,22,3) indicator, encompassing both the histogram and signal line, acts as an auxiliary tool and can also be used as a signal source.
Significant speeches and reports (always noted in the news calendar) can profoundly influence the price dynamics. Hence, trading during their release calls for heightened caution. It may be reasonable to exit the market to prevent abrupt price reversals against the prevailing trend.
Beginners should always remember that not every trade will yield profit. Establishing a clear strategy coupled with sound money management is the cornerstone of sustained trading success.