Analyzing Friday's trades:
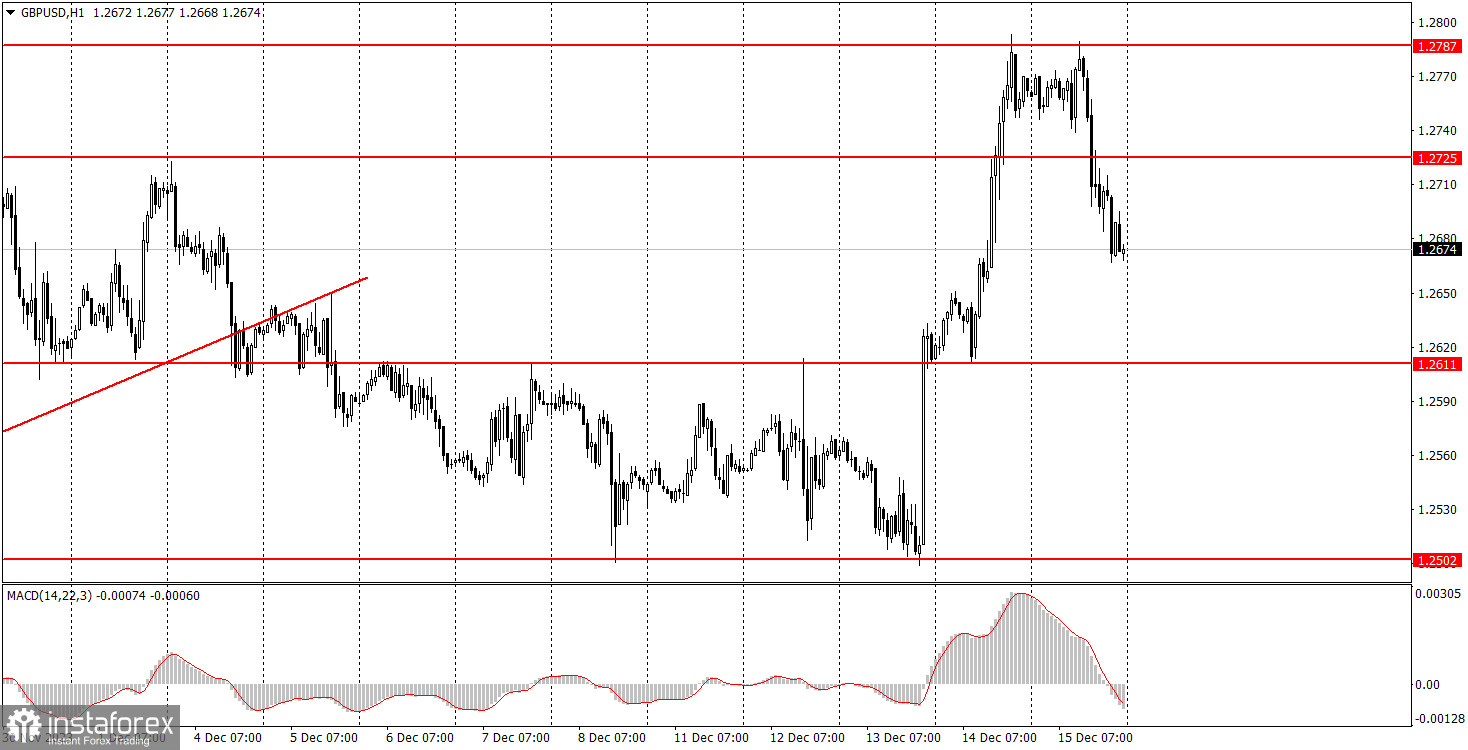
GBP/USD on 30M chart
GBP/USD showed negative trades on Friday. We warned you about the possibility of a strong correction on Wednesday evening, but on Thursday, the Bank of England held its meeting, and its results can be considered hawkish. BoE Governor Andrew Bailey distanced himself from the possibility of a key rate cut in the near future, saying that the rate should be kept at the current level for a very long time, and did not rule out a possible rate hike if the situation requires it. Naturally, Bailey meant that if inflation starts to rise or stops decreasing. The market immediately seized on this statement, and instead of falling logically, the pair moved upwards.
However, on Friday, the fundamental background no longer interfered with the correction. The PMI data in the services and manufacturing sectors of the UK and the US were not impressive enough for the market to significantly react to them after the two key central bank meetings. The British PMIs were slightly worse than expected, but they clearly did not provoke a 100-pip drop in the pound. Therefore, we saw a classic downward correction, which may continue into the new week.
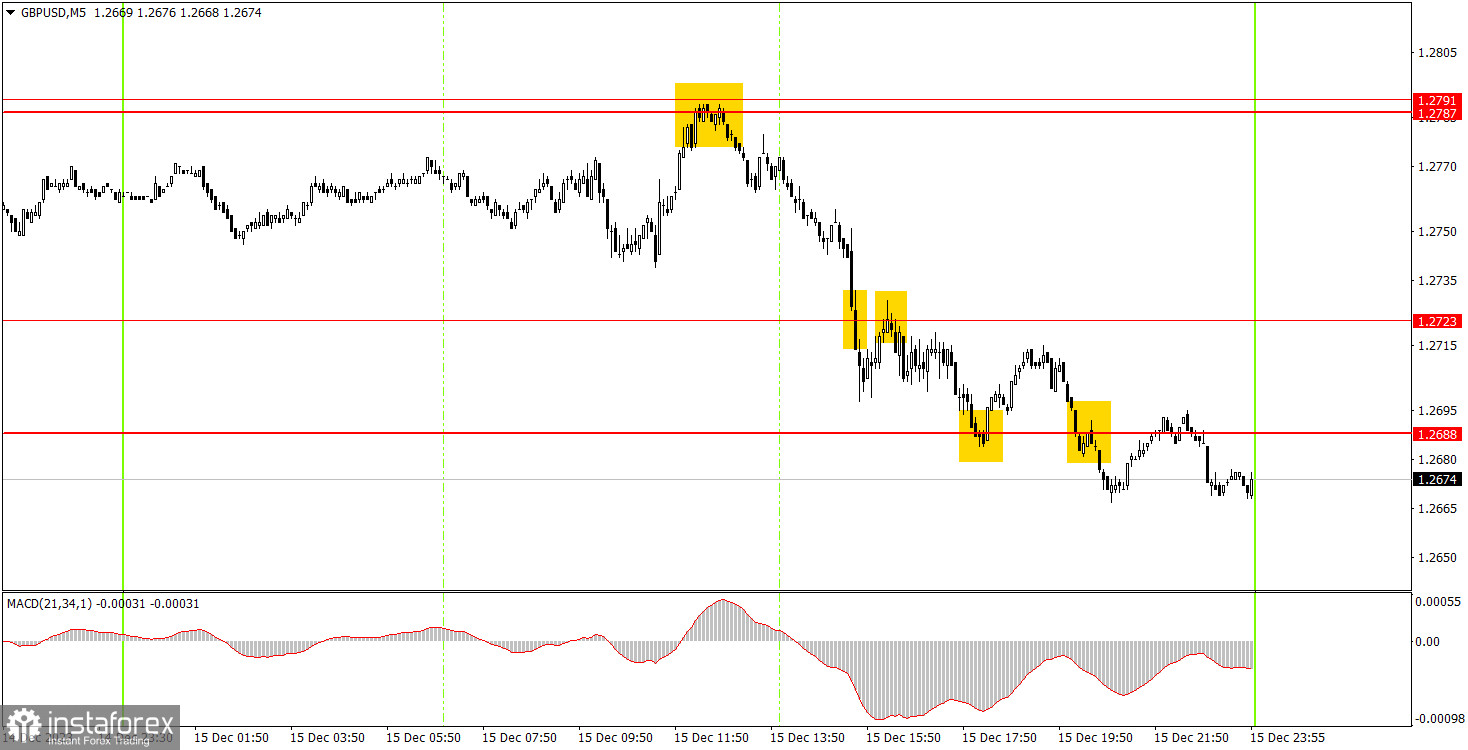
GBP/USD on 5M chart
On the 5-minute chart, several trading signals were generated, and the movement was quite good. The rebound from the area of 1.2787-1.2791, as we warned, triggered a decline, during which the pairs surpassed the levels 1.2723 and 1.2688. Beginners should have closed the short position on the first buy signal, around the 1.2688 level. This trade brought a profit of about 70 pips. But the buy signal around the 1.2688 level should not have been executed. It formed too late, a few hours before the market closed. If someone managed to work it out, they did not incur a loss, as the pair rose by 20 pips.
Trading tips on Monday:
On the hourly chart, the GBP/USD pair has resumed its uptrend, but not for long. On Wednesday and Thursday, the British pound had specific reasons to rise, but it no longer had any of those on Friday. It is unlikely that they will appear in the upcoming week either, so it would be logical for the pair to return to the 1.2502 level.
On Monday, we recommend focusing on the level of 1.2688, which the pair has already surpassed. We are unlikely to see volatile movements, but short positions are more preferable. We believe that you can hold shorts until the price is firmly above the 1.2688 level.
The key levels on the 5M chart are 1.2270, 1.2310, 1.2372-1.2387, 1.2457, 1.2502, 1.2544, 1.2605-1.2611, 1.2688, 1.2723, 1.2787-1.2791, 1.2848-1.2860, 1.2913. On Monday, there are no important events lined up in either the UK or the US. Thus, volatility may decrease, we might witness a flat, but the corrective downtrend may also persist.
Basic trading rules:
1) Signal strength is determined by the time taken for its formation (either a bounce or level breach). A shorter formation time indicates a stronger signal.
2) If two or more trades around a certain level are initiated based on false signals, subsequent signals from that level should be disregarded.
3) In a flat market, any currency pair can produce multiple false signals or none at all. In any case, the flat trend is not the best condition for trading.
4) Trading activities are confined between the onset of the European session and mid-way through the U.S. session, after which all open trades should be manually closed.
5) On the 30-minute timeframe, trades based on MACD signals are only advisable amidst substantial volatility and an established trend, confirmed either by a trendline or trend channel.
6) If two levels lie closely together (ranging from 5 to 15 pips apart), they should be considered as a support or resistance zone.
How to read charts:
Support and Resistance price levels can serve as targets when buying or selling. You can place Take Profit levels near them.
Red lines represent channels or trend lines, depicting the current market trend and indicating the preferable trading direction.
The MACD(14,22,3) indicator, encompassing both the histogram and signal line, acts as an auxiliary tool and can also be used as a signal source.
Significant speeches and reports (always noted in the news calendar) can profoundly influence the price dynamics. Hence, trading during their release calls for heightened caution. It may be reasonable to exit the market to prevent abrupt price reversals against the prevailing trend.
Beginners should always remember that not every trade will yield profit. Establishing a clear strategy coupled with sound money management is the cornerstone of sustained trading success.