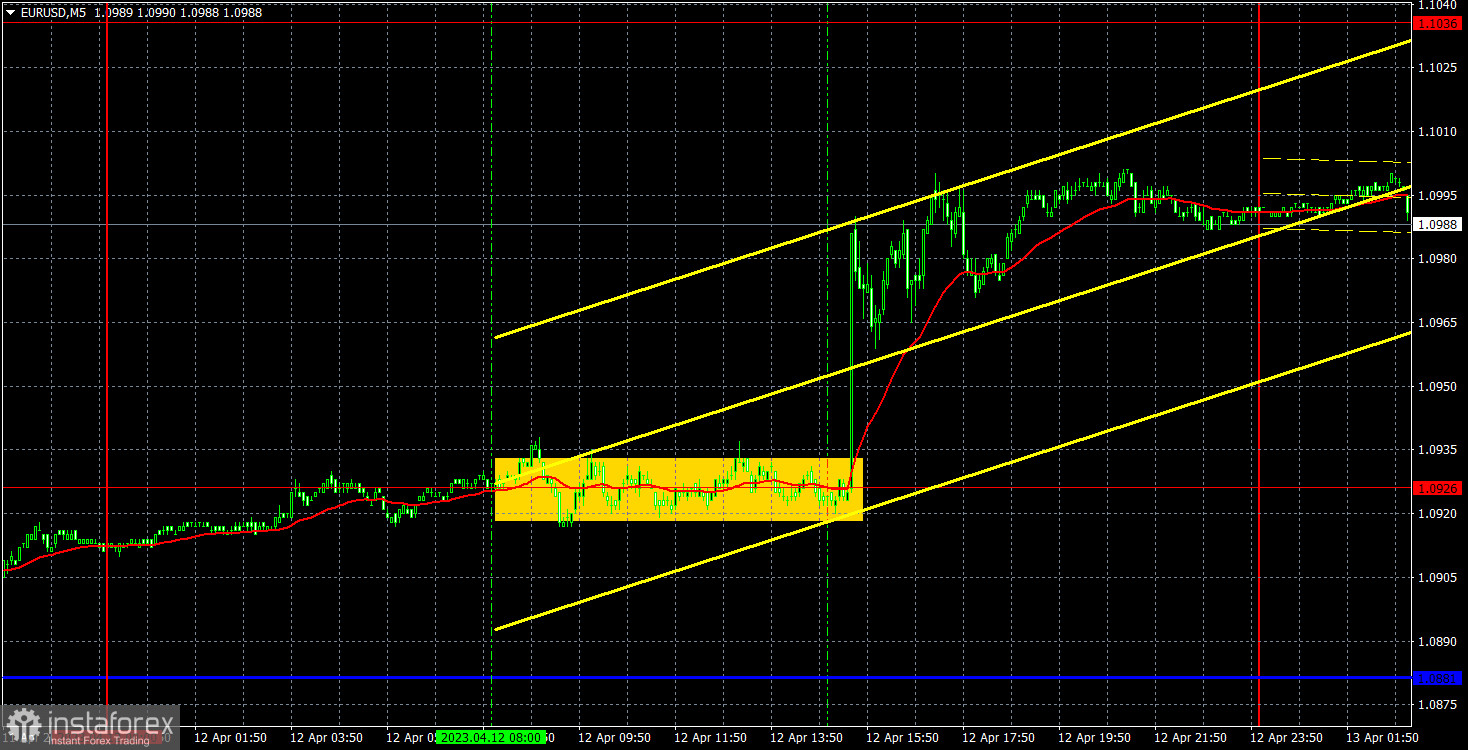
5M chart of EUR/USD
EUR/USD traded higher on Wednesday. This time,we can consider it groundless, but, as we mentioned in fundamental articles, the dollar could have grown on the US inflation report. The fact is that the main indicator fell by 1%, but core inflation increased by 0.1% and now exceeds the main indicator. Perhaps, for the Federal Reserve, core inflation is not as important as many experts say. Maybe the market doesn't consider core inflation to be more important than the main one. Or perhaps traders just got a new reason to buy the euro and sell the dollar. Either way, the euro sharply rose during the US session, although the pair was completely immobilized in the first half of the day.
There won't be much to discuss about trading signals. During the entire European session, the pair moved precisely along the 1.0926 level. At this time, traders could open a position, but it quickly became clear that we were dealing with a flat, so we closed with a small loss. There was no chance to work out the pair's growth in the second half of the day unless you were psychic. The signal was formed exactly when the inflation report was released, and by that time, the pair had already covered 90% of the upward movement. Therefore, it wasn't wise to open a long position based on such a signal. And there were no other signals on Wednesday.
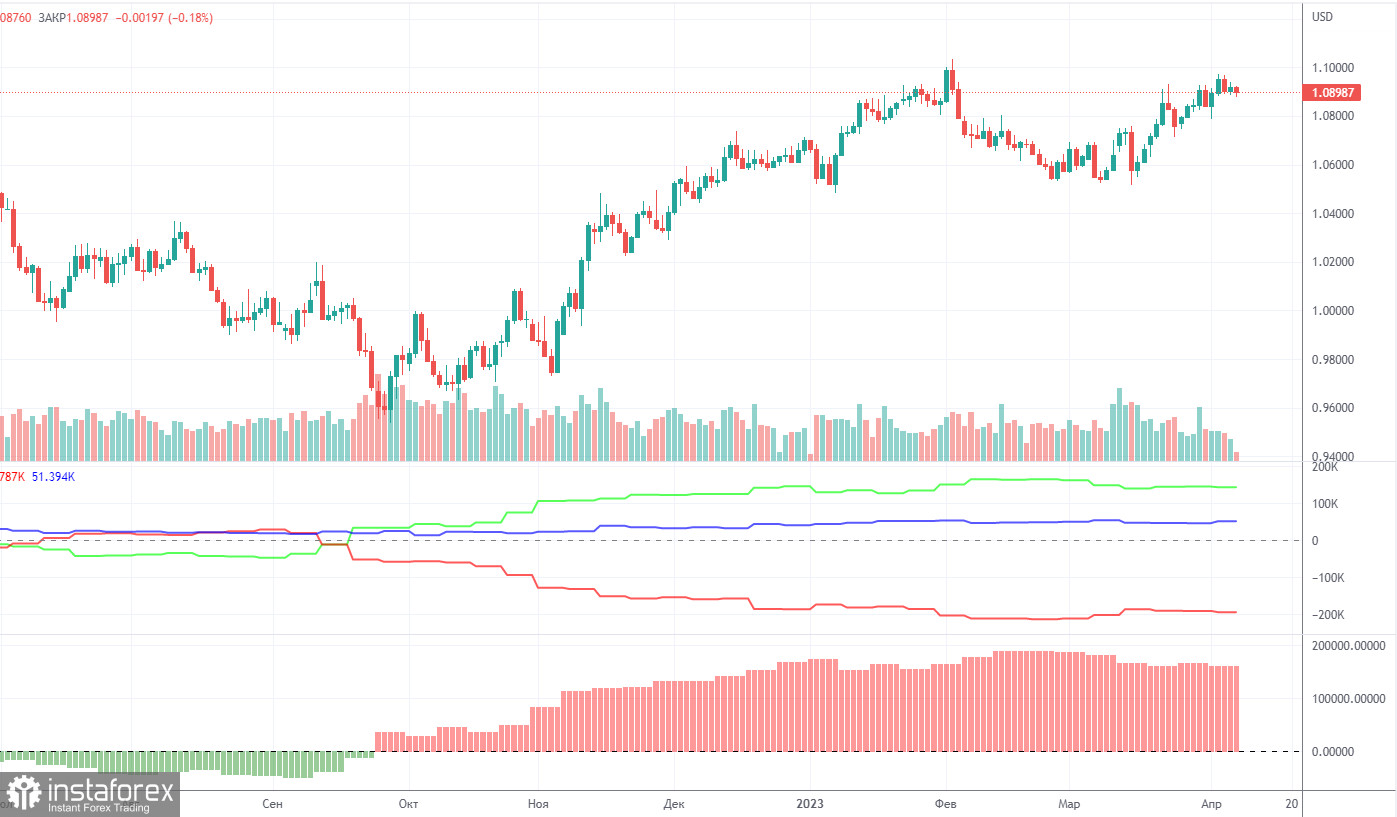
COT report:
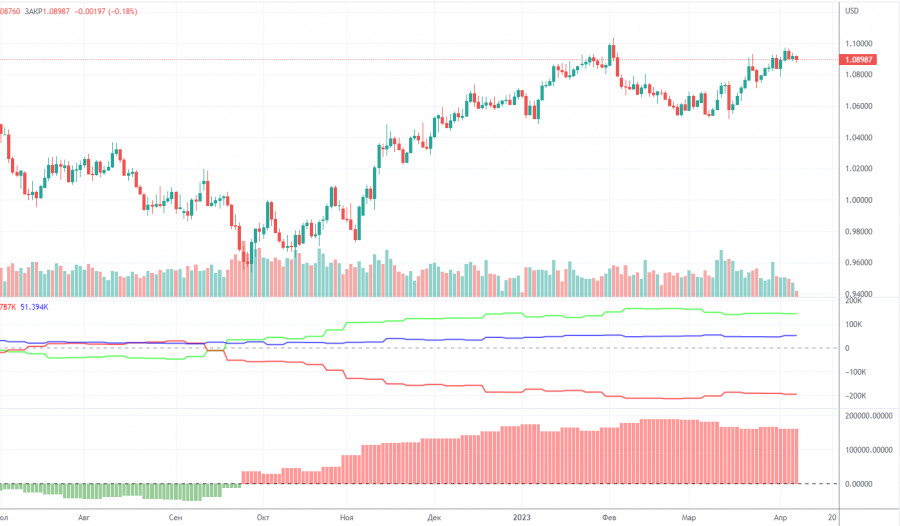
On Friday, a new COT report for April 4th was released. The CFTC has caught up with the lost time and now publishes reports that correspond to the current time period. In the past few months, the picture has been entirely consistent with what has been happening in the market. The picture above clearly shows that the net position of major players (the second indicator) has been growing since the beginning of September 2022. At the same time, the European currency also began to rise. At the moment, the net position of non-commercial traders remains bullish and very high, as does the position of the European currency, which cannot even properly correct downward. Importantly, a relatively high "net position" value suggests the scenario that an uptrend will be over soon. This is signaled by the first indicator, where the red and green lines have moved far apart from each other, which often prefaces the end of a trend. The European currency tried to go down, but we have only seen a minor downward retracement so far. During the last reporting week, the number of Buy contracts among the non-commercial group increased by 2,500, while the number of short contracts rose by 4,100. Accordingly, the net position has hardly changed. The number of long positions is higher than the number of shorts among non-commercial traders by 143,000. A correction is still on the horizon, so even without COT reports, it is clear that EUR/USD should resume its decline.
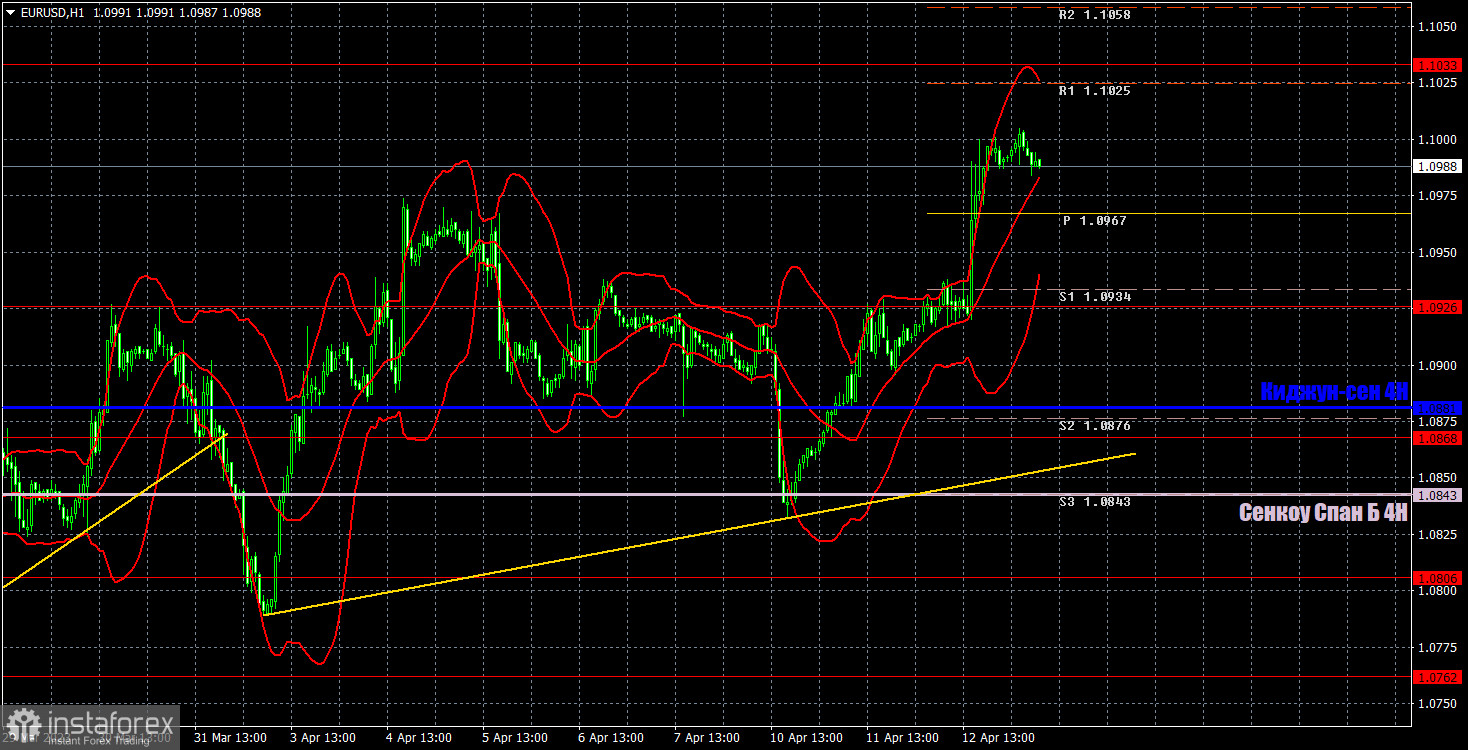
1H chart of EUR/USD
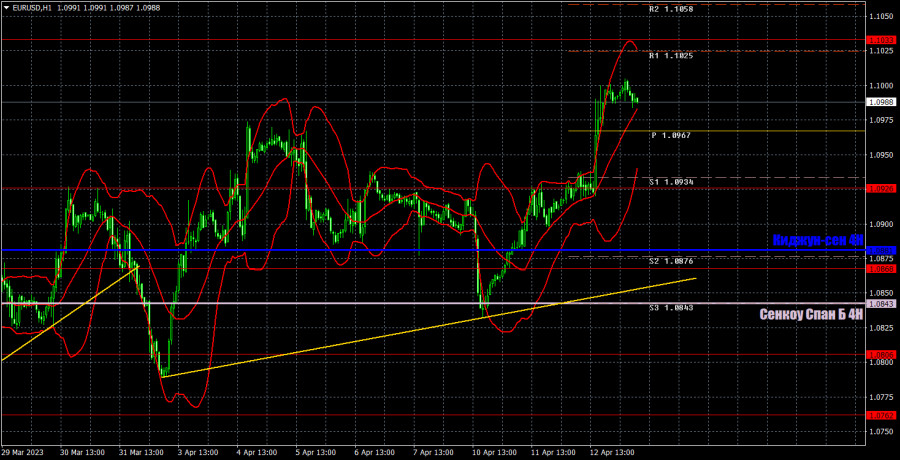
On the one-hour chart, the pair maintains the uptrend, as evidenced by its position above the trend line and the Ichimoku indicator lines. We can only consider the option of starting a downtrend once the price consolidates below the Ichimoku indicator lines, but this would be difficult, although both lines are in close proximity. Traders still refuse to sell, and without short positions, we won't see a bearish correction again. On Thursday, important levels are seen at 1.0658-1.0669, 1.0762, 1.0806, 1.0868, 1.0926, 1.1033, 1.1137-1.1185, 1.1234, 1.1274, as well as Senkou Span B (1.0843) and Kijun-sen (1.0881) lines. Ichimoku indicator lines can move intraday, which should be taken into account when determining trading signals. There are also support and resistance although no signals are made near these levels. They could be made when the price either breaks or rebounds from these extreme levels. Do not forget to place Stop Loss at the breakeven point when the price goes by 15 pips in the right direction. In case of a false breakout, it could save you from possible losses. On April 13th, only secondary reports will be published in the European Union and the United States. In Europe, we have the industrial production for February, and in the United States, there's the Producer Price Index and unemployment claims. The market could react to such data if the results significantly differ from projections.
Indicators on charts:
Resistance/support - thick red lines, near which the trend may stop. They do not make trading signals.
Kijun-sen and Senkou Span B are the Ichimoku indicator lines moved to the hourly timeframe from the 4-hour timeframe. They are also strong lines.
Extreme levels are thin red lines, from which the price used to bounce earlier. They can produce trading signals.
Yellow lines are trend lines, trend channels, and any other technical patterns.
Indicator 1 on the COT chart is the size of the net position of each trader category.
Indicator 2 on the COT chart is the size of the net position for the Non-commercial group of traders.