Analyzing Friday's trades:
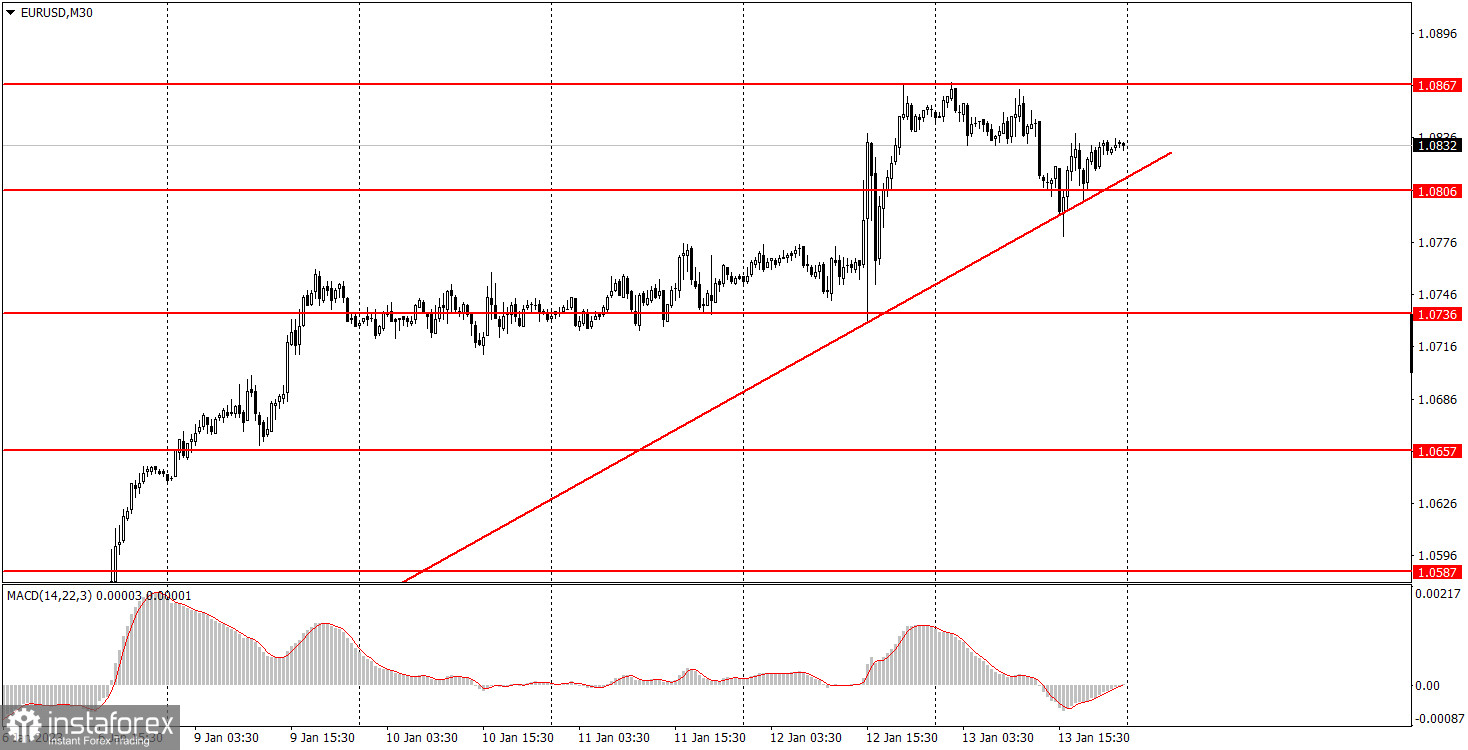
EUR/USD on 30M chart
EUR/USD traded much more quietly on Friday than on Thursday, which is not surprising, because the macroeconomic background was much weaker. Reports on industrial production in the EU and consumer sentiment in the U.S. were the only reports that traders could assess on Friday. Both of these reports were ignored. The euro did not rise even after we received good data from the EU and the USD did not rise either. We have formed an ascending trend line, which has three pivot points and clearly indicates that the uptrend persists. At the same time, we can see that the upward momentum has been getting weaker lately, and the price could be below the trend line as early as Monday. This is in line with my expectations since I've been waiting for a strong bearish correction for a long time. The euro could still rise next week since the market is still more inclined to buy the euro than to buy the US dollar. But at the same time, it would be more logical for the pair to enter a bearish correction.
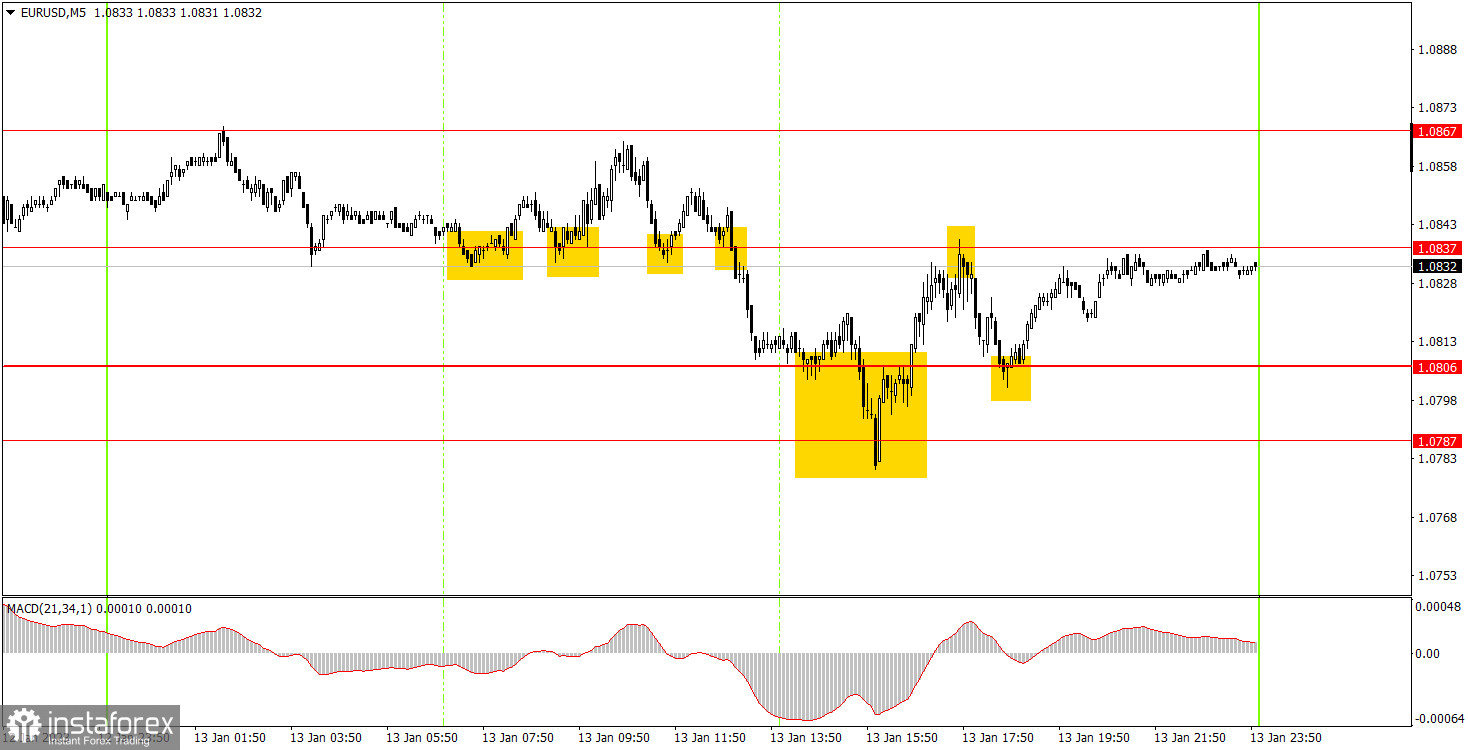
EUR/USD on M5 chart
There were quite a lot of trading signals on Friday. First, the price rebounded from 1.0837 three times, but only once managed to go up at least 15 points. Thus, there was one long position that was closed at Stop Loss, and the second one with a bit of a loss. The fourth sell signal should not have been executed. Then there was a buy signal at 1.0787-1.0806, afterwards the price rose to 1.0837. You could earn about 10 points of profit on the long position. The rebound from 1.0837 should not have been used, and the last buy signal was formed too late. Therefore, all in all beginners did not gain any profit or loss during the day.
Trading tips on Monday:
A bullish sentiment on the 30-minute chart. Next week's macroeconomic and fundamental background will be interesting again, and I believe that it is more likely to support the euro than the dollar. But at the same time, consolidation below the trend line will be a strong signal for the downtrend, which is technically overdue. On the 5-minute chart, it is recommended to trade at the levels 1.0657-1.0668, 1.0697, 1.0736, 1.0787-1.0806, 1.0837, 1.0905, 1.0923-1.0933, 1.0966, 1.0989. As soon as the price passes 15 pips in the right direction, you should set a Stop Loss to breakeven. There are no important events or reports planned for Monday in the European Union or the United States, so volatility may decrease sharply and there may be no trend.
Basic rules of the trading system:
1) The strength of the signal is determined by the time it took the signal to form (a rebound or a breakout of the level). The quicker it is formed, the stronger the signal is.
2) If two or more positions were opened near a certain level based on a false signal (which did not trigger a Take Profit or test the nearest target level), then all subsequent signals at this level should be ignored.
3) When trading flat, a pair can form multiple false signals or not form them at all. In any case, it is better to stop trading at the first sign of a flat movement.
4) Trades should be opened in the period between the start of the European session and the middle of the US trading hours when all positions must be closed manually.
5) You can trade using signals from the MACD indicator on the 30-minute time frame only amid strong volatility and a clear trend that should be confirmed by a trendline or a trend channel.
6) If two levels are located too close to each other (from 5 to 15 pips), they should be considered support and resistance levels.
On the chart:
Support and Resistance levels are the levels that serve as targets when buying or selling the pair. You can place Take Profit near these levels.
Red lines are channels or trend lines that display the current trend and show in which direction it is better to trade now.
The MACD indicator (14, 22, and 3) consists of a histogram and a signal line. When they cross, this is a signal to enter the market. It is recommended to use this indicator in combination with trend patterns (channels and trendlines).
Important announcements and economic reports that can be found on the economic calendar can seriously influence the trajectory of a currency pair. Therefore, at the time of their release, we recommend trading as carefully as possible or exiting the market in order to avoid sharp price fluctuations.
Beginners on Forex should remember that not every single trade has to be profitable. The development of a clear strategy and money management is the key to success in trading over a long period of time.