empty
 
 
14.11.2024 03:36 AM
Overview of EUR/USD on November 14; The Euro's Collapse Continues

This image is no longer relevant

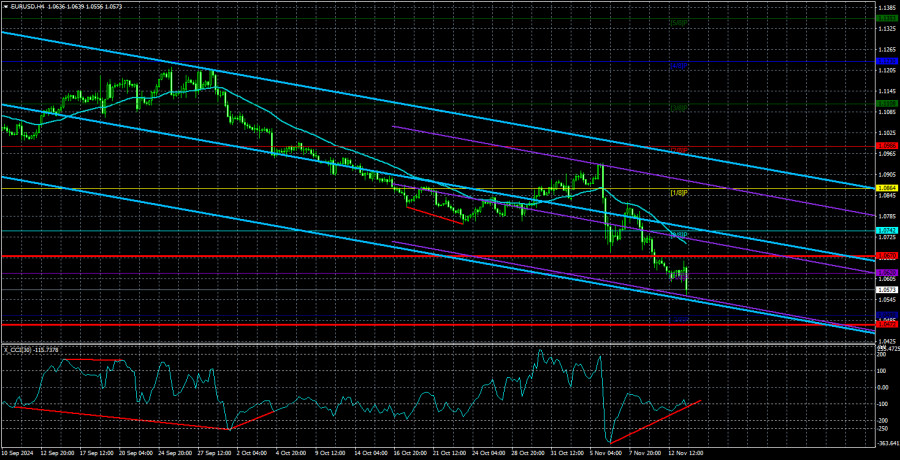
The EUR/USD currency pair continued its downward trend on Wednesday. While corrections are possible during any movement, the current overall technical picture is clear. Looking at the weekly timeframe, we see a downtrend that has persisted for over 15 years. The same trend is visible on the daily chart but on a larger scale. On the 4-hour chart, a local downtrend began a month and a half ago. No matter the timeframe, the pattern remains consistent. Thus, the first conclusion is obvious: any upward movement is merely a correction. We've been saying this even during the two-year period when the pair was rising.

In our opinion, only a sharp shift in the global fundamental backdrop could reverse this long-term trend. What could cause such a shift? In the coming months, the pair's decline may halt once the market balances it at a fair value, which we estimate to be between 1.0000 and 1.0200. After that, new factors may drive the pair in either direction. It's important to note that even 15-year trends eventually end. A global reversal could occur around the 1.0000 level, but such a reversal would require significant and objective reasons.

At present, we see no prerequisites for such developments. The U.S. economy is much stronger than Europe's, with no evident looming issues. The return of Donald Trump to power is more likely to be positive for the dollar than negative. Unless the U.S. becomes involved in a war, we see no basis for the euro to experience long-term growth.

Meanwhile, Europe faces significantly higher geopolitical risks. The conflict in Ukraine continues unabated, and no one knows when, where, or under what conditions it might end. The European Union's active support for Ukraine could potentially lead to a conflict with Russia, and the consequences of such a scenario are uncertain. Over the next few years, the European Union may remain in a zone of elevated risk, unlike the United States.

Returning to the near term, we believe the dollar will continue to strengthen until the market fully prices in the impacts of monetary policy easing by both the European Central Bank and the Federal Reserve. What are we hearing from the ECB? Primarily that rates will continue to decrease. This comes from a baseline rate already 1% lower than the Fed's. Furthermore, the Fed and ECB have cut rates by 0.75%, but Trump's inflationary policies might lead to smaller rate cuts in the U.S., providing another boost to the dollar.

This image is no longer relevant

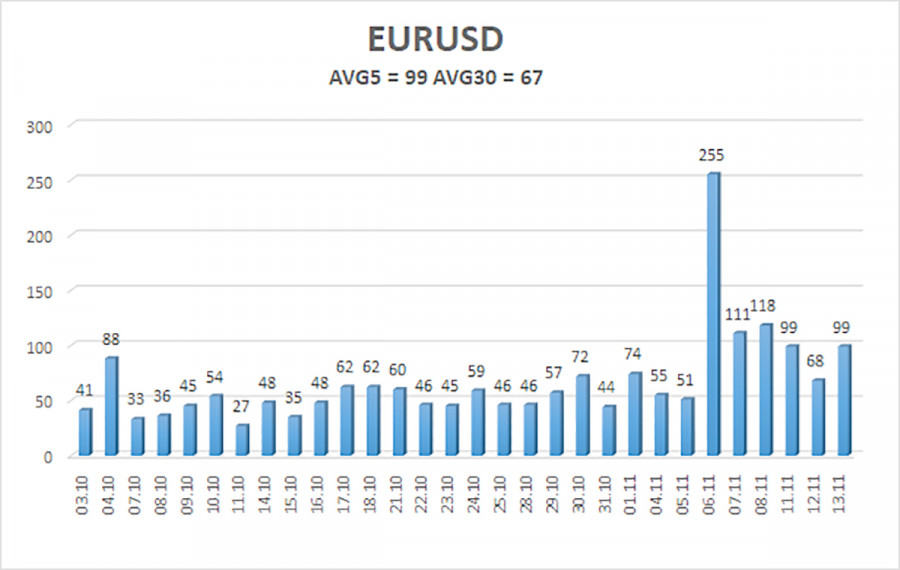
Over the past five trading days, the average volatility of EUR/USD stands at 99 pips, categorized as "high." We anticipate movement between 1.0472 and 1.0670 on Thursday. The higher linear regression channel points downward, indicating a sustained global downtrend. The CCI indicator dipped into the oversold area, signaling the start of a new correction. However, the correction was weak and has already ended. A new bullish divergence is forming.

Support Levels:

S1: 1.0498

Resistance Levels:

R1: 1.0620

R2: 1.0742

R3: 1.0864

Trading Recommendations:

The EUR/USD pair continues its downward movement. We have consistently indicated our expectation of a medium-term decline in the euro in recent months and fully support the bearish trend. The market has likely already priced in most or all future Fed rate cuts. If this is the case, the dollar has no medium-term reasons to weaken, though there were a few reasons before. Short positions remain viable with targets at 1.0498 and 1.0472 as long as the price remains below the moving average (MA). If trading purely based on technicals, then long positions can only be considered if the price moves above the MA, with targets at 1.0742 and 1.0864, though we currently do not recommend any long positions.

Explanation of Illustrations:

Linear Regression Channels help determine the current trend. If both channels are aligned, it indicates a strong trend.

Moving Average Line (settings: 20,0, smoothed) defines the short-term trend and guides the trading direction.

Murray Levels act as target levels for movements and corrections.

Volatility Levels (red lines) represent the likely price range for the pair over the next 24 hours based on current volatility readings.

CCI Indicator: If it enters the oversold region (below -250) or overbought region (above +250), it signals an impending trend reversal in the opposite direction.

Paolo Greco,
انسٹافاریکس کا تجزیاتی ماہر
© 2007-2024
انسٹافاریکس کے ساتھ کرپٹو کرنسی کی معاملاتی تبدیلیوں سے کمائیں۔
میٹا ٹریڈر 4 ڈاؤن لوڈ کریں اور اپنی پہلی ٹریڈ کھولیں۔
  • Grand Choice
    Contest by
    InstaForex
    InstaForex always strives to help you
    fulfill your biggest dreams.
    مقابلہ میں شامل ہوں
  • چانسی ڈیپازٹ
    اپنے اکاؤنٹ میں 3000 ڈالر جمع کروائیں اور حاصل کریں$5000 مزید!
    ہم نومبر قرعہ اندازی کرتے ہیں $5000چانسی ڈیپازٹ نامی مقابلہ کے تحت
    اپنے اکاؤنٹ میں 3000 ڈالر جمع کروانے پر موقع حاصل کریں - اس شرط پر پورا اُترتے ہوئے اس مقابلہ میں شرکت کریں
    مقابلہ میں شامل ہوں
  • ٹریڈ وائز، ون ڈیوائس
    کم از کم 500 ڈالر کے ساتھ اپنے اکاؤنٹ کو ٹاپ اپ کریں، مقابلے کے لیے سائن اپ کریں، اور موبائل ڈیوائسز جیتنے کا موقع حاصل کریں۔
    مقابلہ میں شامل ہوں
  • 100 فیصد بونس
    اپنے ڈپازٹ پر 100 فیصد بونس حاصل کرنے کا آپ کا منفرد موقع
    بونس حاصل کریں
  • 55 فیصد بونس
    اپنے ہر ڈپازٹ پر 55 فیصد بونس کے لیے درخواست دیں
    بونس حاصل کریں
  • 30 فیصد بونس
    ہر بار جب آپ اپنا اکاؤنٹ ٹاپ اپ کریں تو 30 فیصد بونس حاصل کریں
    بونس حاصل کریں

تجویز کردہ مضامین

ابھی فوری بات نہیں کرسکتے ؟
اپنا سوال پوچھیں بذریعہ چیٹ.
Widget callback