EUR/USD
Analysis:
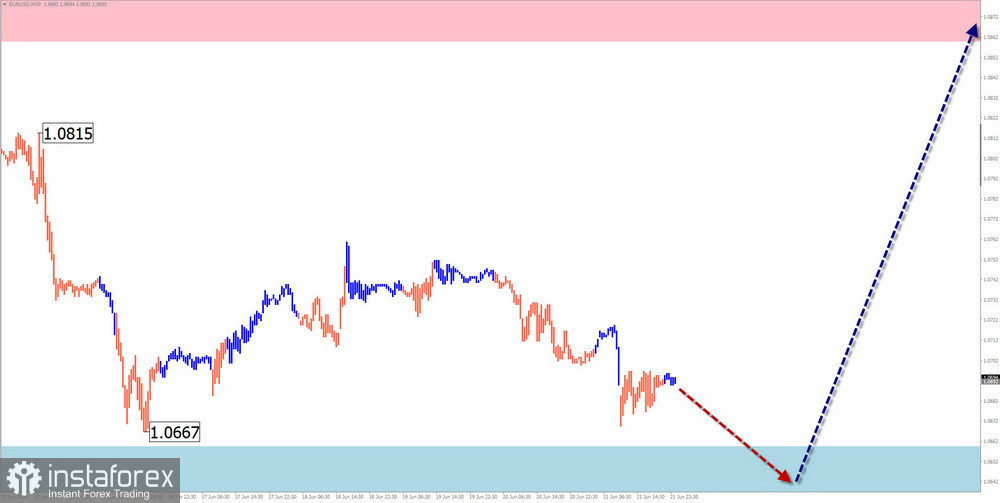
Since July last year, the euro's price direction has been influenced by a bearish wave pattern. The wave structure has formed a "horizontal pennant" pattern. Since mid-April, the price has shown signs of forming an upward wave with potential for reversal. If this pattern is confirmed, a new wave according to the dominant trend could commence. The bearish phase since May 16 has lacked reversal potential and has remained within the correction of the bullish wave pattern.
Forecast:
In the coming days, we can expect the completion of the euro's downward movement and a transition of major fluctuations into a sideways trend. There is a high probability of the price stopping near the calculated support area and setting conditions for a reversal. The beginning of an upward price movement is most likely towards the end of the week.
Potential Reversal Zones
Resistance: 1.0860/1.0910
Support: 1.0660/1.0610
Recommendations:
Sales: Possible with reduced volume within individual sessions, aiming for potential not exceeding the resistance zone.
Purchases: These can be used in trading deals after corresponding reversal signals appear on your trading systems near the resistance zone.
USD/JPY
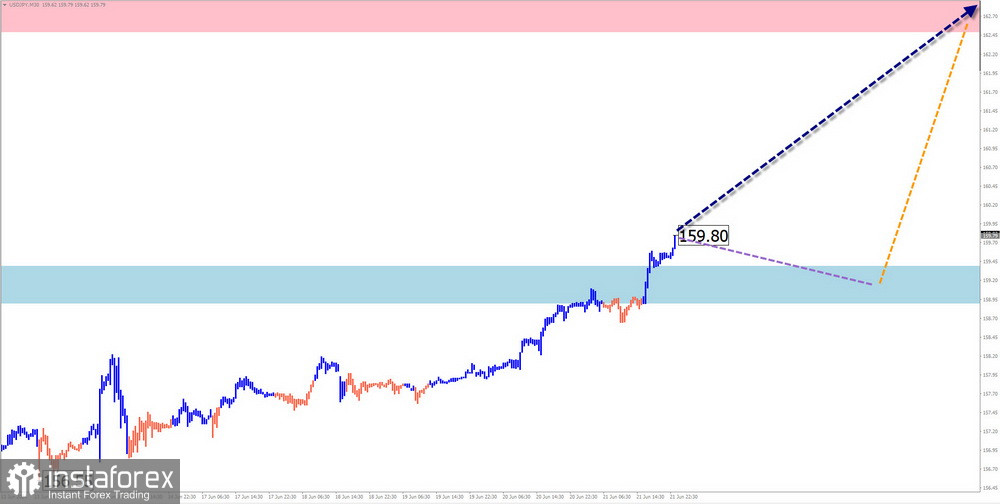
Analysis: Since the beginning of last year, the price movement direction of the Japanese yen major currency has been influenced by the algorithm of a dominant, unfinished upward wave. Throughout this year, the wave structure has been developing its final part (C). This movement has entered its final phase. The pair's quotes are approaching the lower boundary of the potential weekly reversal zone on the chart.
Forecast:
Throughout the upcoming week, the upward price movement vector of the Japanese yen major currency is expected to continue, with the potential to rise towards the calculated resistance zone. In the early days, short-term declines could not be ruled out, but they were not beyond the support boundaries.
Potential Reversal Zones
Resistance:
Support:
Recommendations:
Sales: Carry a high degree of risk, which may lead to losses.
Purchases: In the coming days, they may become the primary direction for trading deals. Reducing the trading volume is safer.
GBP/JPY
Analysis:
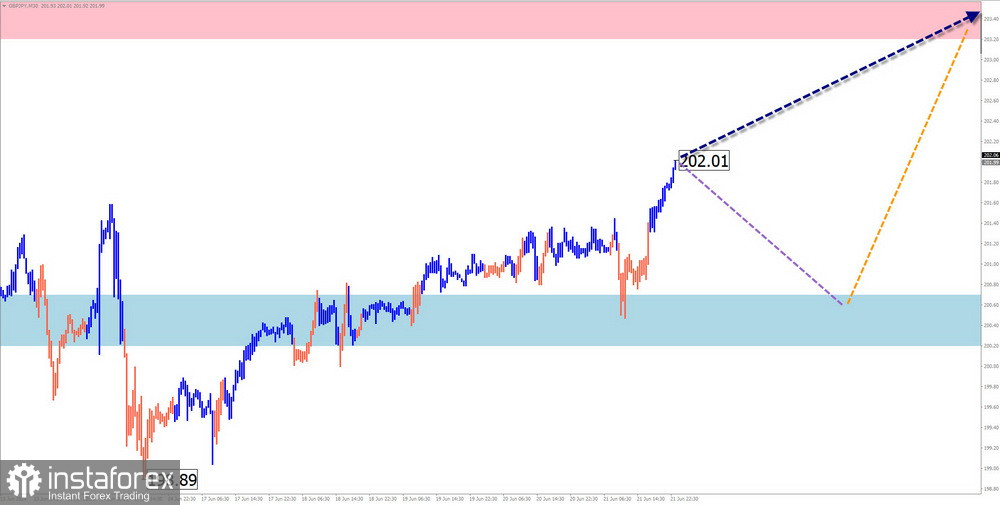
From a short-term perspective, the unfinished wave of the GBP/JPY pair has been counting since December of last year. Quotes have reached the lower boundary of the broad potential reversal zone on the weekly timeframe. Analysis of the structure indicates its incompleteness. Before continuing the upward movement, the price needs to be corrected.
Forecast:
During the upcoming weekly period, we expect the pair to continue its upward trend and potentially reach the calculated resistance zone. In the early days, a sideways movement or a short-term pullback downward cannot be ruled out. The calculated support zone limits the pair's downward price movement.
Potential Reversal Zones
Resistance:203.20/203.70
Support:200.70/200.20
Recommendations:
Purchases: These can be used within individual sessions after confirmed signals appear on your trading systems. The calculated resistance limits the potential for the weekly movement.
Sales: These are risky and could lead to losses.
USD/CAD
Analysis:
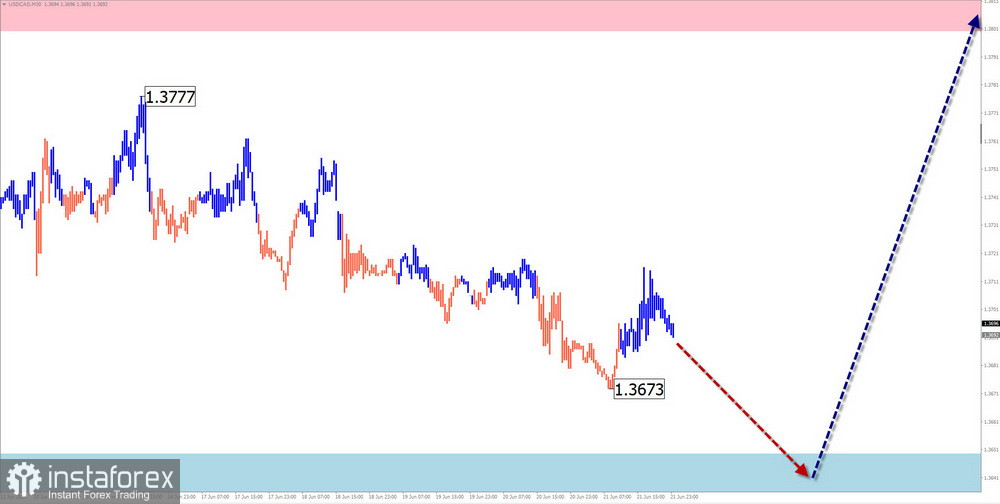
The horizontal pennant formed on the Canadian dollar chart over the past few months is nearing completion. Analysis of the current wave structure shows the incompleteness of its final part (C). The price is approaching the upper boundary of the potential reversal zone on the daily chart.
Forecast:
In the coming days, we can expect the continuation of the pair's downward movement, potentially reaching the calculated zone. Subsequently, a reversal and resumption of upward price movement from the support boundary are likely. The resistance zone represents the maximum expected upper level of the pair's weekly volatility.
Potential Reversal Zones
Resistance: 1.3800/1.3850
Support: 1.3650/1.3600
Recommendations:
Sales: Possible within intraday trading with fractional volumes within the calculated support.
Purchases: Consideration can be given for trading after confirmed reversal signals appear around the support area.
NZD/USD
Brief Analysis:
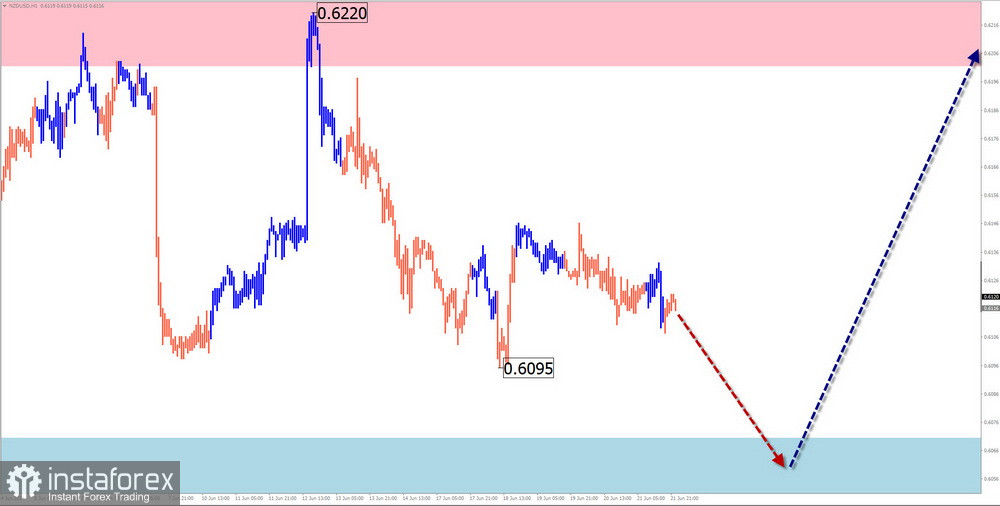
The New Zealand dollar has been moving within the dominant bearish wave since July last year. This wave corrects a larger upward trend. The unfinished upward segment has been counting since mid-April. At the time of analysis, the counter-trend phase since May 16 does not exceed the internal correction boundaries.
Weekly Forecast:
In the next couple of days, we can expect the downward movement trend to continue. Around the calculated support zone, a change in the movement direction to sideways is expected, forming conditions for a reversal. The resumption of upward price movement is more likely in the latter half of the week.
Potential Reversal Zones
Resistance: 0.6200/0.6250
Support: 0.6070/0.6020
Recommendations
Sales: Have limited potential and may be risky.
Purchases: These can be used in trading after corresponding reversal signals appear around the support zone.
Gold
Analysis:
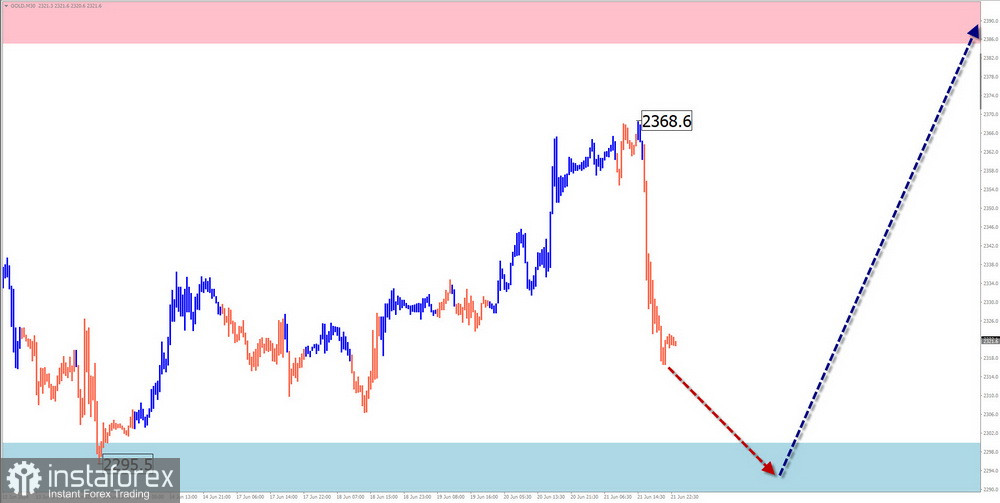
Since April of this year, gold prices have continued to move predominantly horizontally. The downward plane forming serves as a correction to the previous bullish trend. The price is approaching the lower boundary of the sideways corridor formed on the chart over the last two months.
Forecast:
In the coming days, a decline is expected, with possible pressure on the support zone. Subsequently, we can expect a reversal formation and a resumption of price increases. The highest activity in price fluctuations is expected closer to the weekend.
Potential Reversal Zones
- Resistance: 2380.0/2400.0
- Support: 2300.0/2280.0
Recommendations:
- Sales: Have limited potential and may result in losses.
- Purchases: These can be considered the primary direction for trading after corresponding reversal signals appear around the support area on your trading systems.
Explanations: In simplified wave analysis (SWA), all waves consist of 3 parts (A-B-C). The latest unfinished wave is analyzed on each timeframe (TF). Dotted lines indicate expected movements.
Attention: The wave algorithm does not take into account the duration of instrument movements over time!