Analyzing Wednesday's trades:
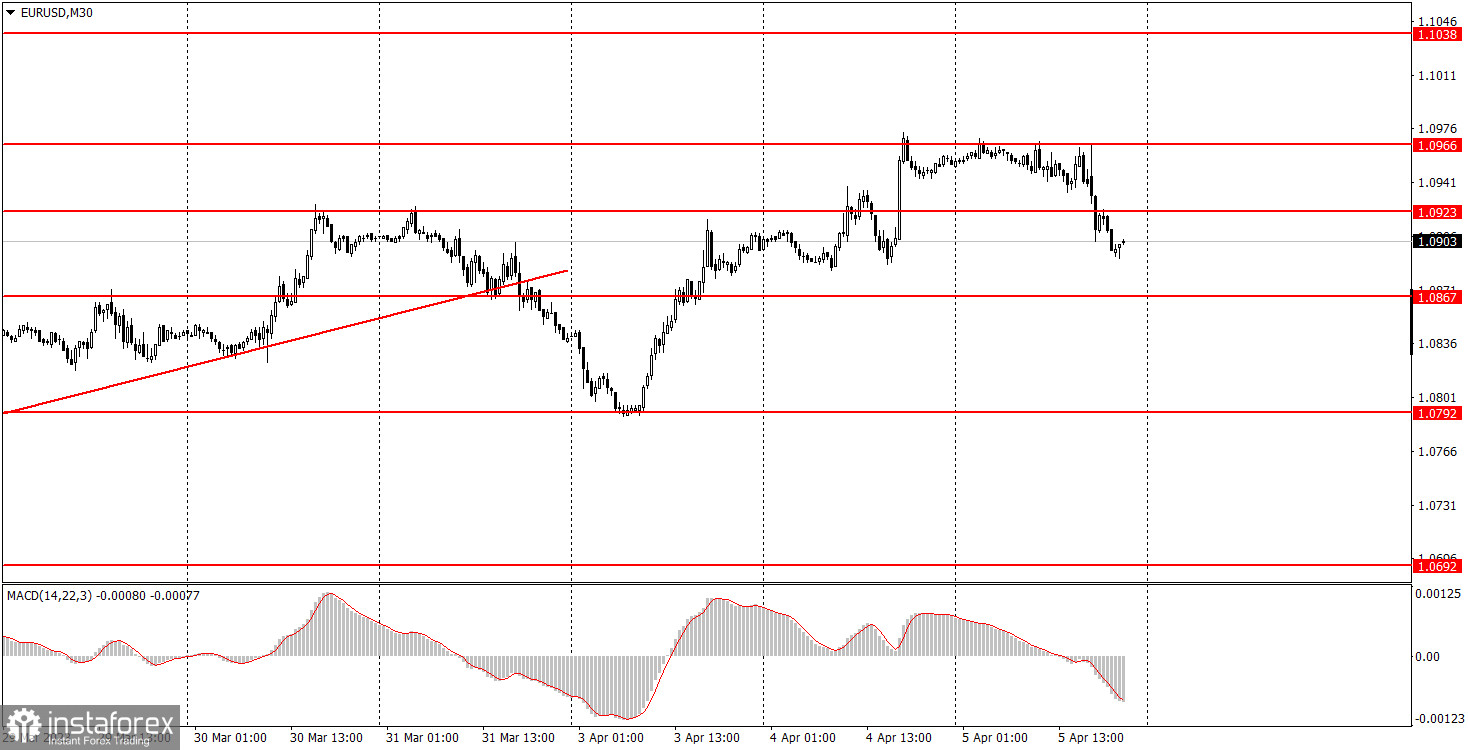
EUR/USD on 30M chart
EUR/USD finally edged down on Wednesday. However, the 70-pip movement can hardly be considered a "correction" or "end of trend". More likely, it's just a small pullback. Yes, the bulls also need a rest sometimes. In general, the pair maintains the uptrend after it settled below the uptrend line. Such an interpretation sounds great. But that is the reality at the moment. On Wednesday, the most interesting thing was there were quite a lot of macro data. For instance, the EU and US released services PMIs (and there was also an ISM report in the US). It also released an ADP report, which is considered by many people as an analogue of the NonFarm Payrolls. And the two most important reports of the day (ISM and ADP) were disappointing. ADP was only 145,000 with a forecast of 200,000 and ISM was down to 51.2 with a forecast of 54-54.5. Therefore, the dollar was not supposed to strengthen!!!! But we are already used to the fact that there is no logic in the movements now, and the market does not pay attention to the macroeconomic background at all.
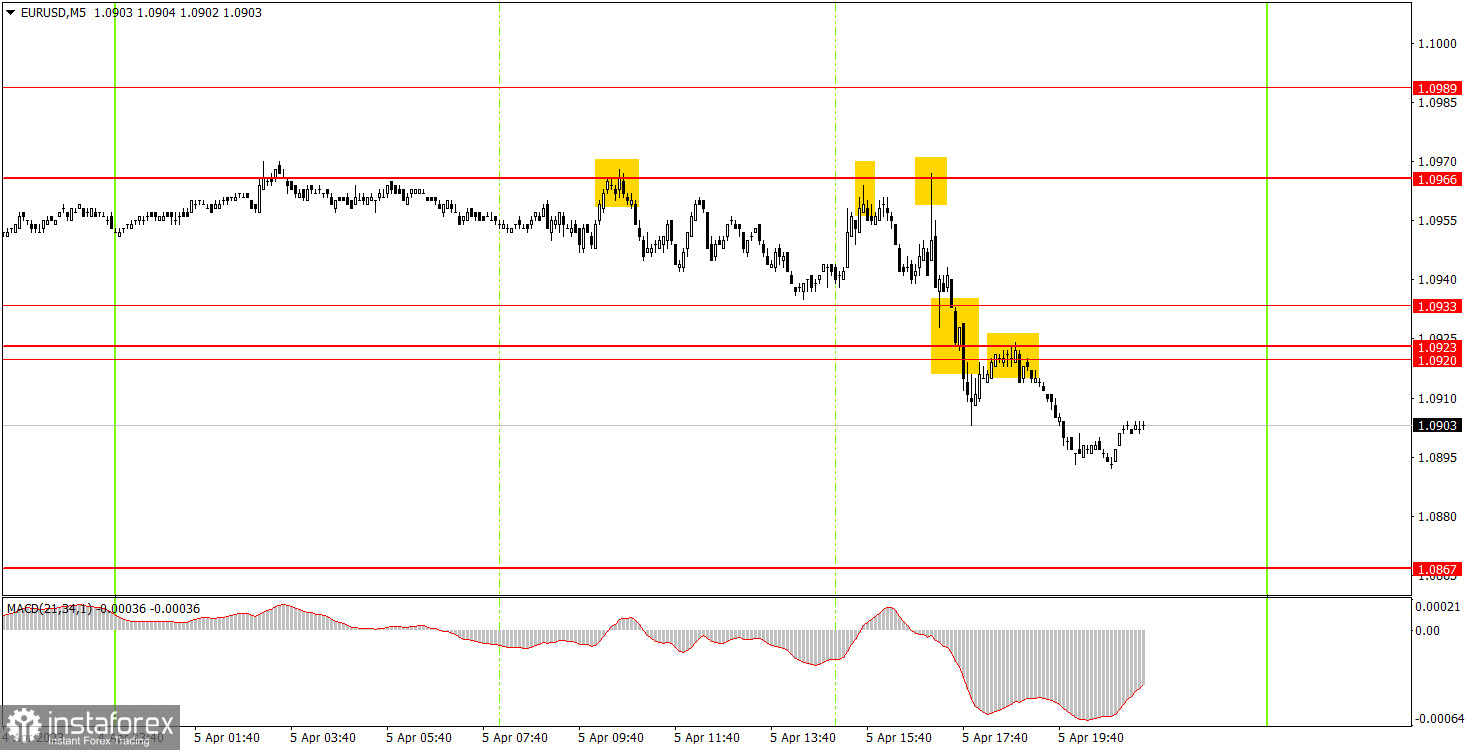
EUR/USD on 5M chart
Speaking of trading signals, they were not interesting. The pair bounced from 1.0966 three times, and in the first two cases it managed to go down only 15 points. Therefore, Stop Loss at breakeven should have been set on both short positions, on which deals were closed. The third sell signal should not have been triggered, since the first two signals near the same level were false. It was possible to try to work through 1.0920-1.0933, which made it possible for beginners to earn about 10 points. Better than nothing...
Trading tips on Thursday:
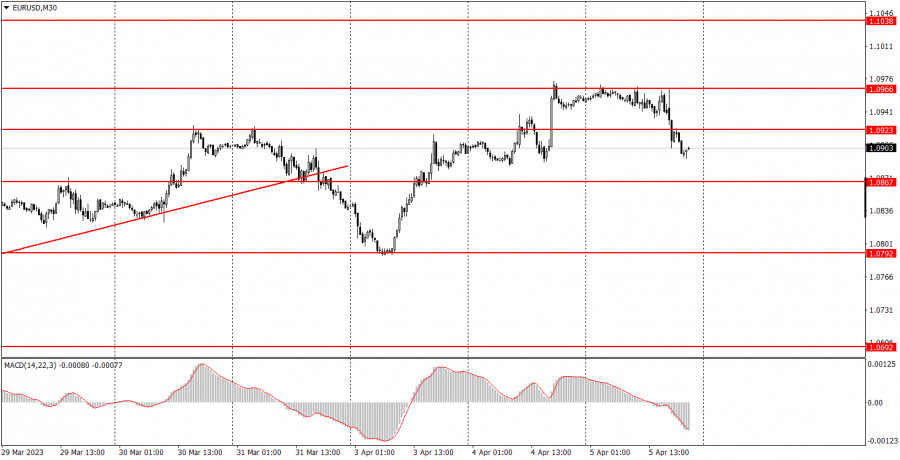
On the 30-minute chart, the pair settled below the new uptrend line and... continues the upward movement. That's all you need to know about what's going on in the market at the moment. No matter what happens, no matter what the signals are, in most cases, the euro is just rising. It falls when the macroeconomic background supports its growth. This was the case on Monday and Tuesday and Wednesday. Fundamental and macroeconomic backgrounds are almost irrelevant right now. On the 5-minute chart, it is recommended to trade at the levels 1.0692, 1.0737, 1.0792, 1.0857-1.0867, 1.0920-1.0933, 1.0966, 1.0989, 1.1038, 1.1070, 1.1132. As soon as the price passes 15 pips in the right direction, you should set a Stop Loss to breakeven. No important events or reports in the EU and the US on Thursday. Just an ordinary report on U.S. jobless claims, which may provoke a reaction only if the actual value sharply deviates from forecasts.
Basic rules of the trading system:
1) The strength of the signal is determined by the time it took the signal to form (a rebound or a breakout of the level). The quicker it is formed, the stronger the signal is.
2) If two or more positions were opened near a certain level based on a false signal (which did not trigger a Take Profit or test the nearest target level), then all subsequent signals at this level should be ignored.
3) When trading flat, a pair can form multiple false signals or not form them at all. In any case, it is better to stop trading at the first sign of a flat movement.
4) Trades should be opened in the period between the start of the European session and the middle of the US trading hours when all positions must be closed manually.
5) You can trade using signals from the MACD indicator on the 30-minute time frame only amid strong volatility and a clear trend that should be confirmed by a trendline or a trend channel.
6) If two levels are located too close to each other (from 5 to 15 pips), they should be considered support and resistance levels.
On the chart:
Support and Resistance levels are the levels that serve as targets when buying or selling the pair. You can place Take Profit near these levels.
Red lines are channels or trend lines that display the current trend and show in which direction it is better to trade now.
The MACD indicator (14, 22, and 3) consists of a histogram and a signal line. When they cross, this is a signal to enter the market. It is recommended to use this indicator in combination with trend patterns (channels and trendlines).
Important announcements and economic reports that can be found on the economic calendar can seriously influence the trajectory of a currency pair. Therefore, at the time of their release, we recommend trading as carefully as possible or exiting the market in order to avoid sharp price fluctuations.
Beginners on Forex should remember that not every single trade has to be profitable. The development of a clear strategy and money management is the key to success in trading over a long period of time.