empty
 
 
26.11.2024 03:39 AM
Overview of the EUR/USD Pair for November 26: Don't Fall for the Correction Trick

This image is no longer relevant

The EUR/USD currency pair started the new week with a rise. However, this strengthening of the euro should not mislead traders. The week began with a slight upward gap, and gaps tend to "close" rather quickly. What does this mean? This means the price could return to its previous lows, which reached last week, as early as today. Moreover, this might happen without any macroeconomic or fundamental reasons. So, although the week began with growth, this move could be a false signal.

Furthermore, the euro has been declining for two consecutive months, which might seem like a lot. But it's worth remembering that the preceding growth lasted for two years. Yes, the increase was not as sharp or rapid as the current decline, but two months is still a short period in the context of long-term trends. Thus, there are no solid reasons to suggest that the euro's decline is over.

Last week, we warned that a correction could start since the price had reached the 1.0450 level, which marks the lower boundary of the horizontal channel on the weekly timeframe. However, this does not imply a correction of 500 pips or more to the upside. If the global trend remains bearish, what should be expected from the euro according to technical analysis principles?

It's also important to note that the fundamental background causing the euro's decline remains unchanged. For two years, the market priced in the Federal Reserve's monetary policy easing, leaving no further reasons to sell the dollar. The U.S. dollar's two-year decline was driven by a single factor, while other factors were largely ignored. Now, these factors are being reflected in the market.

Additionally, the Fed might lower the key rate much less aggressively than traders initially expected at the beginning of the year. For instance, market participants may have priced in a 3% rate cut, while the actual cut could be 2% or even less. This provides another growth factor for the U.S. dollar.

By the end of the year, it also became clear that the European Central Bank was lowering the key rate faster than expected due to the eurozone economy, which had been struggling for two years and had recently started raising concerns among European policymakers and officials. Thus, the Fed might cut rates less than expected, and the ECB might lower rates more aggressively or faster. All these factors suggest that the euro is likely to continue its decline.

This image is no longer relevant

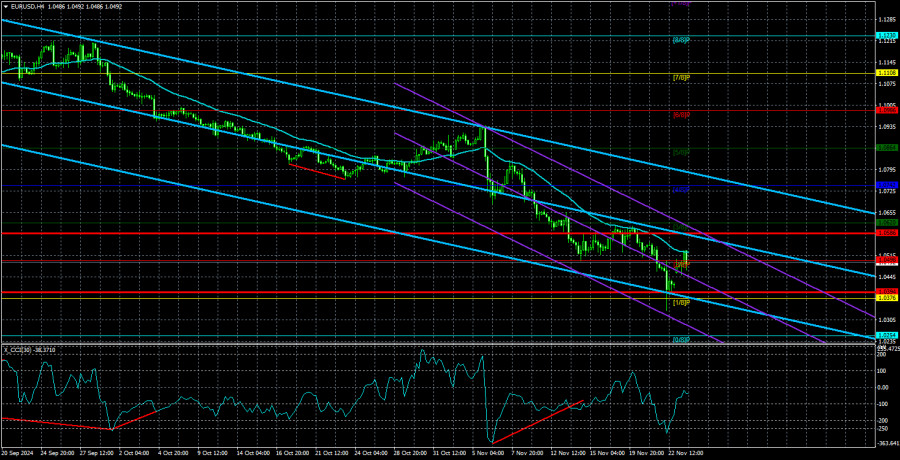
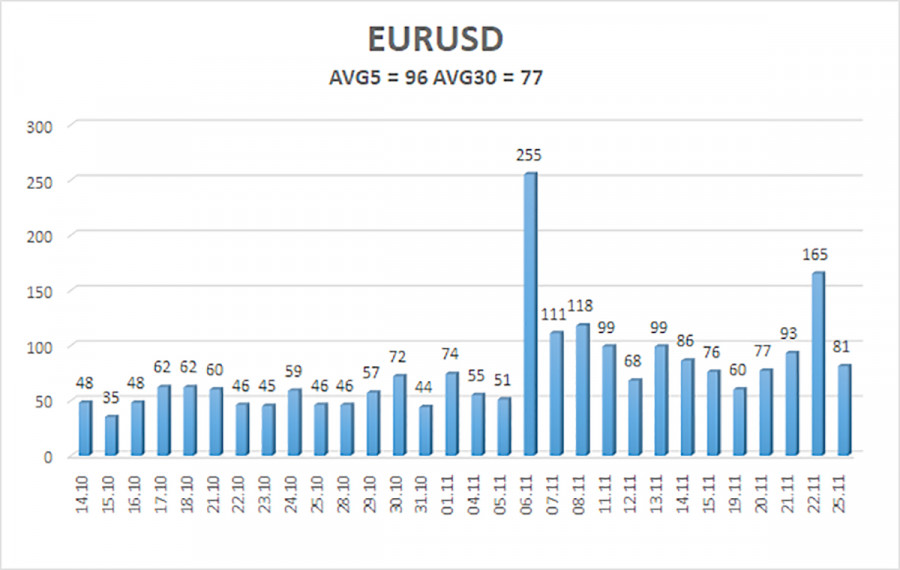
The average volatility of the EUR/USD pair over the last five trading days as of November 26 is 96 pips, classified as "high." We expect the pair to trade between 1.0394 and 1.0586 on Tuesday. The higher linear regression channel points downward, indicating a sustained global bearish trend. The CCI indicator frequently enters oversold territory, forming bullish divergences, which result only in minor pullbacks. The bearish trend remains dominant.

Key Support Levels:

  • S1: 1.0376
  • S2: 1.0254
  • S3: 1.0132

Key Resistance Levels:

  • R1: 1.0498
  • R2: 1.0620
  • R3: 1.0742

Trading Recommendations:

The EUR/USD pair continues its downward movement. For months, we have emphasized our expectation of a decline in the euro in the medium term, fully supporting the bearish trend. Likely, the market has already priced in all or most of the Fed's future rate cuts. If this is the case, the dollar still has no reasons for a medium-term decline—although it had few such reasons before. Short positions remain viable with targets at 1.0376 and 1.0254 as long as the price stays below the moving average. For those trading solely on technical signals, long positions could be considered above the moving average with targets at 1.0620 and 1.0742; we currently do not recommend long positions.

Explanation of Illustrations:

Linear Regression Channels help determine the current trend. If both channels are aligned, it indicates a strong trend.

Moving Average Line (settings: 20,0, smoothed) defines the short-term trend and guides the trading direction.

Murray Levels act as target levels for movements and corrections.

Volatility Levels (red lines) represent the likely price range for the pair over the next 24 hours based on current volatility readings.

CCI Indicator: If it enters the oversold region (below -250) or overbought region (above +250), it signals an impending trend reversal in the opposite direction.

Jana pendapatan melalui perubahan kadar mata wang kripto dengan InstaForex.
Muat turun MetaTrader 4 dan buka dagangan pertama anda.
  • Grand Choice
    Contest by
    InstaForex
    InstaForex always strives to help you
    fulfill your biggest dreams.
    SERTAI PERADUAN
  • Chancy Deposit
    Deposit akaun anda sebanyak $3,000 dan dapatkan $5000 lebih lagi!
    Dalam November kami membuat cabutan bertuah $5000 dalam Kempen Chancy Deposit!
    Dapatkan peluang untuk menang dengan membuat deposit $ 3000 ke dalam akaun dagangan. Setelah memenuhi syarat ini, anda menjadi peserta kempen.
    SERTAI PERADUAN
  • Trade Wise, Win Device
    Daftar untuk peraduan dan tambah dana akaun anda dengan sekurang-kurangnya AS$ 500 untuk layak memenangi peranti mudah alih.
    SERTAI PERADUAN
  • Bonus 100%
    Peluang istimewa anda untuk menerima bonus 100% pada deposit anda
    DAPATKAN BONUS
  • Bonus 55%
    Dapatkan bonus 55% pada setiap deposit anda
    DAPATKAN BONUS
  • Bonus 30%
    Dapatkan bonus 30% setiap kali anda membuat penambahan dana akaun anda
    DAPATKAN BONUS

Artikel yang dicadangkan

Tidak boleh bertanya sekarang?
Tanya soalan anda di Ruangan bersembang.
Panggilan semula Widget