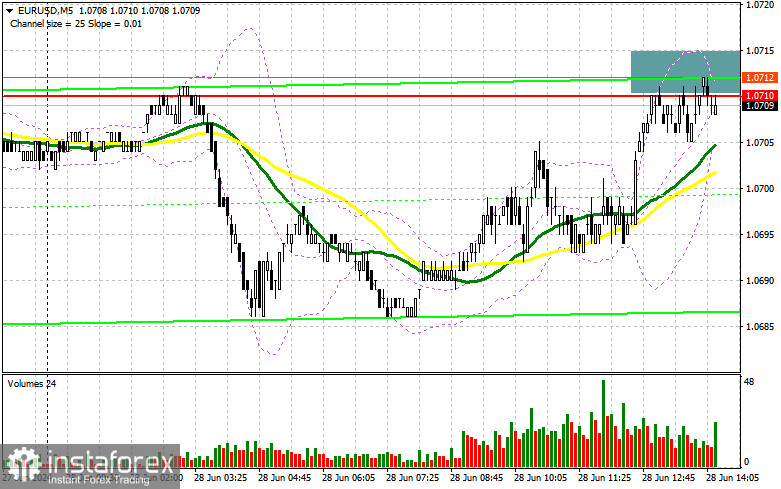
In my morning forecast, I focused on the level of 1.0709 and planned to make trading decisions based on it. Let's look at the 5-minute chart and see what happened there. The rise and formation of a false breakout at 1.0709 led to a sell signal, resulting in the pair falling by only 5 points. After that, the pressure on the euro decreased. However, buyers did not show up either. For this reason, the technical picture was revised for the second half of the day.
To open long positions on EUR/USD, the following is required:
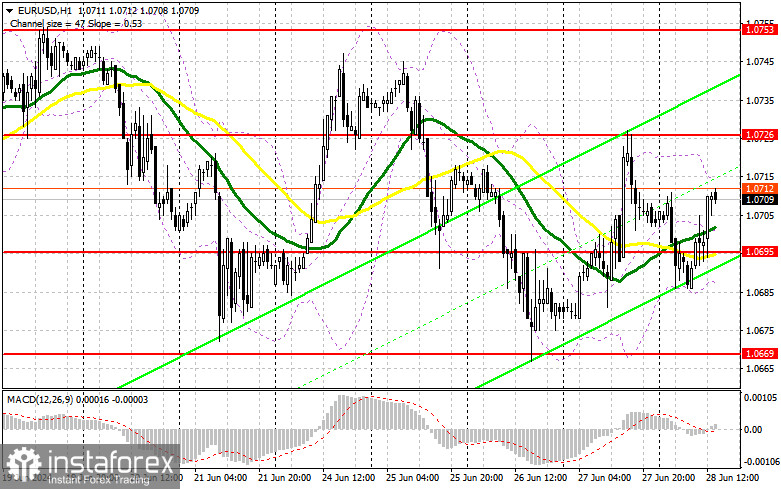
The data for the eurozone mostly met economists' expectations, which did not allow volatility to grow significantly. Let's hope the second half of the day will be more interesting. We have figures for the core Personal Consumption Expenditures (PCE) index in the US for the past month, a crucial parameter for the Federal Reserve System. Growth in the index and increases in personal spending and income levels will positively affect the dollar and lead to a fall in the euro, which we will be prepared for. Acting on a decline after a false breakout around the new support at 1.0695, formed by today's results, is preferable. This will be a suitable entry point for long positions, aiming for the euro to recover by the end of the month to 1.0726, which coincides with yesterday's high. A breakout and upward test of this range will strengthen the pair with a chance to rise to 1.0753. The furthest target will be the high of 1.0789, where I will be fixing profits. Testing this level will give buyers an advantage. In case of a decline in EUR/USD and a lack of activity around 1.0695 in the second half of the day, the pair will continue to trade within the channel but with a fairly high likelihood of further decline. In this case, I will enter only after forming a false breakout around the next support at 1.0669. I plan to open long positions immediately on a rebound from 1.0642, aiming for an upward correction of 30-35 points within the day.
To open short positions on EUR/USD, the following is required:
Sellers showed some activity but did not lead to a significant downward movement. In case of a bullish reaction to the US data, defending the resistance at 1.0726 and a false breakout there will provide a suitable entry point for short positions, aiming for a likely fall to the support at 1.0695, which serves as a kind of midpoint of the sideways channel. A breakout and consolidation below this range amid strong statistics, followed by a reverse test from bottom to top, will provide another selling point, targeting a new low at 1.0669, where I expect to see more active buying. The furthest target will be the low at 1.0642, where I will fix profits. In case of an upward movement in EUR/USD in the second half of the day and the absence of bears at 1.0726, which is more likely, buyers will manage to achieve an upward correction by the end of the month. In this case, I will postpone sales until testing the next resistance at 1.0753. I will also sell there, but only after an unsuccessful consolidation. I plan to open short positions immediately on a rebound from 1.0789, aiming for a downward correction of 30-35 points.
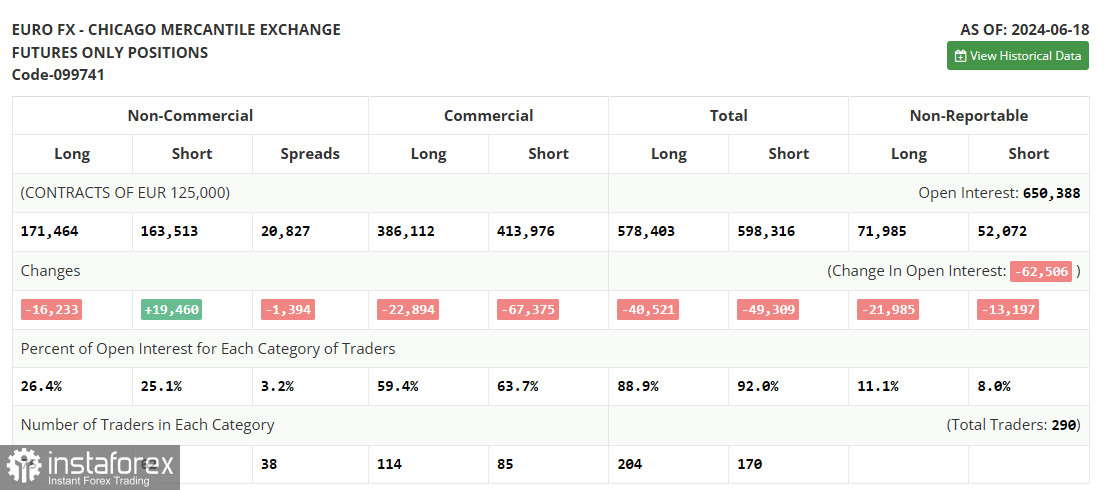
The COT report (Commitment of Traders) for June 18 showed an increase in short positions and a decrease in long positions. The outcomes of the Federal Reserve and European Central Bank meetings significantly impacted the market dynamics. The total number of short and long positions also confirms the current equilibrium and balance on the chart. Considering that no significant statistics are expected in the near future, this equilibrium is likely to persist. However, it is important to understand that the overall trend and bearish direction of EUR/USD have not disappeared, and the euro's decline could resume any moment. According to the COT report, non-commercial long positions decreased by 16,233 to 171,464, while non-commercial short positions increased by 19,460 to 163,513. As a result, the spread between long and short positions decreased by 1,394.
Indicator Signals:
Moving Averages
Trading is conducted around the 30 and 50-day moving averages, indicating a sideways market.
Note: The author considers the period and prices of the moving averages on the H1 hourly chart and differs from the general definition of classical daily moving averages on the D1 daily chart.
Bollinger Bands
In case of a decline, the lower boundary of the indicator, around 1.0680, will serve as support.
Indicator Descriptions:
- Moving average (determines the current trend by smoothing volatility and noise). Period – 50. Marked in yellow on the chart.
- Moving average (determines the current trend by smoothing volatility and noise). Period – 30. Marked in green on the chart.
- MACD indicator (Moving Average Convergence/Divergence – convergence/divergence of moving averages). Fast EMA – period 12. Slow EMA – period 26. SMA – period 9.
- Bollinger Bands. Period – 20.
- Non-commercial traders – speculators such as individual traders, hedge funds, and large institutions using the futures market for speculative purposes and meeting certain requirements.
- Long non-commercial positions represent the total long open position of non-commercial traders.
- Short non-commercial positions represent the total short open positions of non-commercial traders.
Total non-commercial net position is the difference between short and long positions of non-commercial traders.