empty
 
 
28.02.2023 07:54 AM
GBP/USD: Forecast and trading signals on February 28. COT report. Detailed analysis of price movement and trades. The pound started the week on a positive note.

5M chart of GBP/USD

This image is no longer relevant

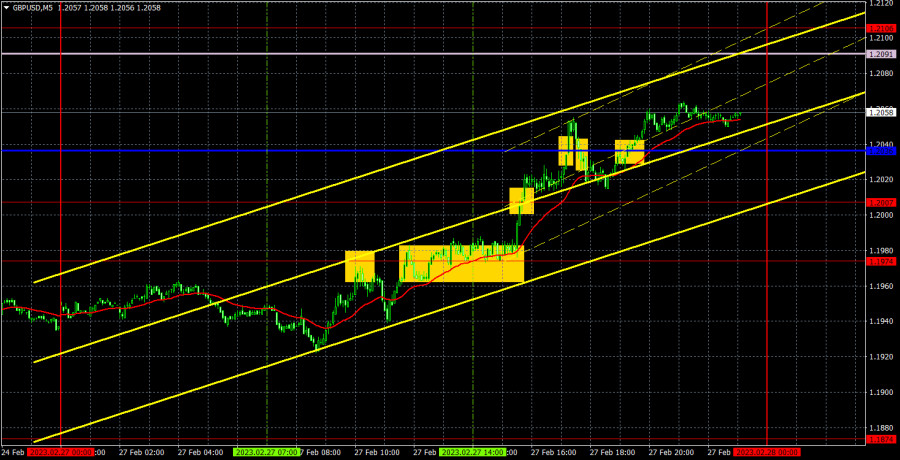
GBP/USD was also trading higher on Monday. The British currency was rising in the European trading session, when there were no important events and reports. So we can conclude that traders would have bought the pair yesterday anyway, regardless of the nature of the US Durable Goods Orders report. The critical line was surpassed during the day, but the pair failed to settle above the Senkou Span B line. Therefore, the pair has a high chance of falling. Moreover, we did not see good reasons for the pound to rise on Monday. There will not be much news and events this week. If the pound manages to bring back the uptrend in such circumstances, it will be the most unexpected. I still expect the pair to fall.

There were plenty of trading signals on Monday, but most of them were too difficult to work out. The first sell signal turned out to be a false one, but the pair managed to pass 20 points down, so traders managed to place a Stop Loss at breakeven. The second buy signal was not bad, but the price was also near 1.2007. Upon overcoming 1.2007, the price was also near the critical line. And after crossing the critical line it was too late to buy, because the pair had already risen 130 points from the daily low. Therefore, traders could try to work out some of the individual signals. They were probably even profitable, but it was inconvenient to trade on Monday.

COT report:

This image is no longer relevant

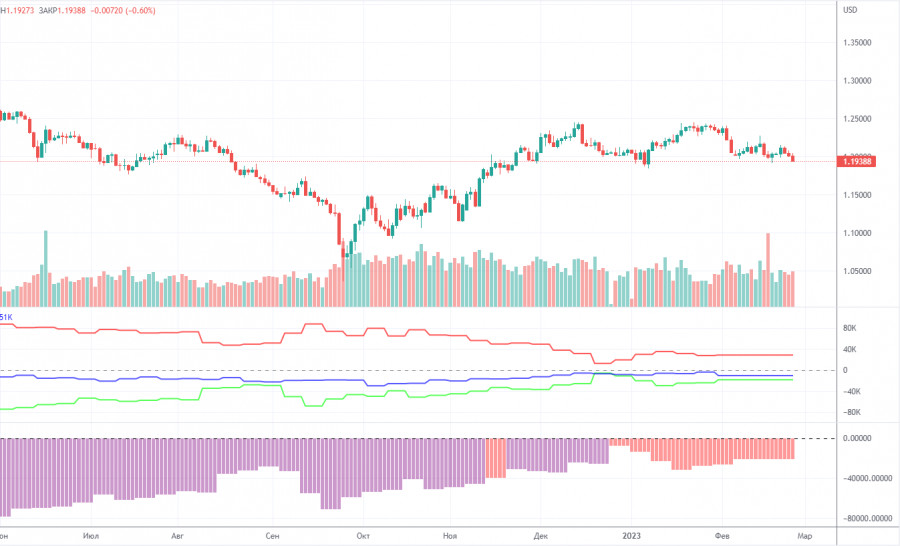
The COT report for the British pound has not been out for a month. The report for January 31 became available on Friday, which makes no sense since it came out a month ago. This report showed minimal changes. In the reporting week, non-commercial traders opened 1,400 long positions while the number of shorts decreased by 4,100. Thus, the net position of non-commercial traders increased by almost 10,000. The value of the net position has been steadily rising in recent months, but large market players are still bearish, and the GBP is rising against the USD (in the medium term), but from a fundamental perspective, it is very difficult to answer the question why it does it. The pound could start to fall in the near future. Formally, it has already started, but so far it looks like a flat. Take note that both major pairs are moving in a similar way, but the net position of the euro is positive and even implies an end of the upward movement, while it is negative for the pound... The non-commercial group of traders has a total of 54,000 long positions and 36,000 shorts. I am still rather skeptical about the long-term uptrend in the pound. The fundamental and geopolitical backgrounds do not favor a strong and swift rise in the British currency.

1H chart of GBP/USD

This image is no longer relevant

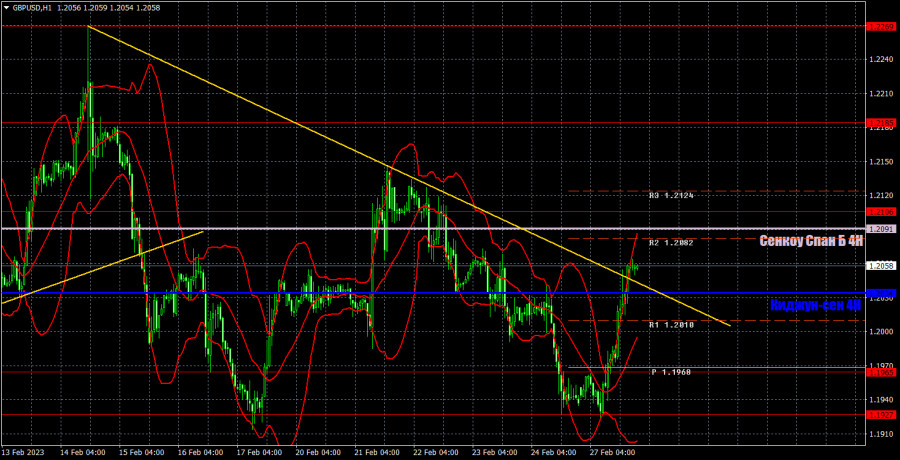
On the one-hour chart, GBP/USD started a fairly strong correction and even settled above the downtrend line. While it has not overcome the Senkou Span B line, we can consider that the downtrend persists. The pair can still fall, but take note that the pair is in the sideways channel on the 24-hour chart, which is important. On February 28, it is recommended to trade at the key level of 1.1760, 1.1874, 1.1927-1.1965, 1.2106, 1.2185, 1.2269. The Senkou Span B (1.2091) and Kijun Sen (1.2034) lines can also generate signals. Rebounds and breakouts from these lines can also serve as trading signals. It is better to set the Stop Loss at breakeven as soon as the price moves by 20 pips in the right direction. The lines of the Ichimoku indicator can change their position throughout the day which is worth keeping in mind when looking for trading signals. On the chart, you can also see support and resistance levels where you can take profit. On Tuesday, no important data or reports are expected in the UK and US. Traders will not have much to react to, but on Monday, the pair showed that it is ready to move quite actively.

Indicators on charts:

Resistance/support - thick red lines, near which the trend may stop. They do not make trading signals.

Kijun-sen and Senkou Span B are the Ichimoku indicator lines moved to the hourly timeframe from the 4-hour timeframe. They are also strong lines.

Extreme levels are thin red lines, from which the price used to bounce earlier. They can produce trading signals.

Yellow lines are trend lines, trend channels, and any other technical patterns.

Indicator 1 on the COT chart is the size of the net position of each trader category.

Indicator 2 on the COT chart is the size of the net position for the Non-commercial group of traders.

Jana pendapatan melalui perubahan kadar mata wang kripto dengan InstaForex.
Muat turun MetaTrader 4 dan buka dagangan pertama anda.
  • Grand Choice
    Contest by
    InstaForex
    InstaForex always strives to help you
    fulfill your biggest dreams.
    SERTAI PERADUAN
  • Chancy Deposit
    Deposit akaun anda sebanyak $3,000 dan dapatkan $9000 lebih lagi!
    Dalam Mei kami membuat cabutan bertuah $9000 dalam Kempen Chancy Deposit!
    Dapatkan peluang untuk menang dengan membuat deposit $ 3000 ke dalam akaun dagangan. Setelah memenuhi syarat ini, anda menjadi peserta kempen.
    SERTAI PERADUAN
  • Trade Wise, Win Device
    Daftar untuk peraduan dan tambah dana akaun anda dengan sekurang-kurangnya AS$ 500 untuk layak memenangi peranti mudah alih.
    SERTAI PERADUAN
  • Bonus 100%
    Peluang istimewa anda untuk menerima bonus 100% pada deposit anda
    DAPATKAN BONUS
  • Bonus 55%
    Dapatkan bonus 55% pada setiap deposit anda
    DAPATKAN BONUS
  • Bonus 30%
    Dapatkan bonus 30% setiap kali anda membuat penambahan dana akaun anda
    DAPATKAN BONUS

Artikel yang dicadangkan

Tidak boleh bertanya sekarang?
Tanya soalan anda di Ruangan bersembang.
Panggilan semula Widget