Analysis of Friday's Trades:
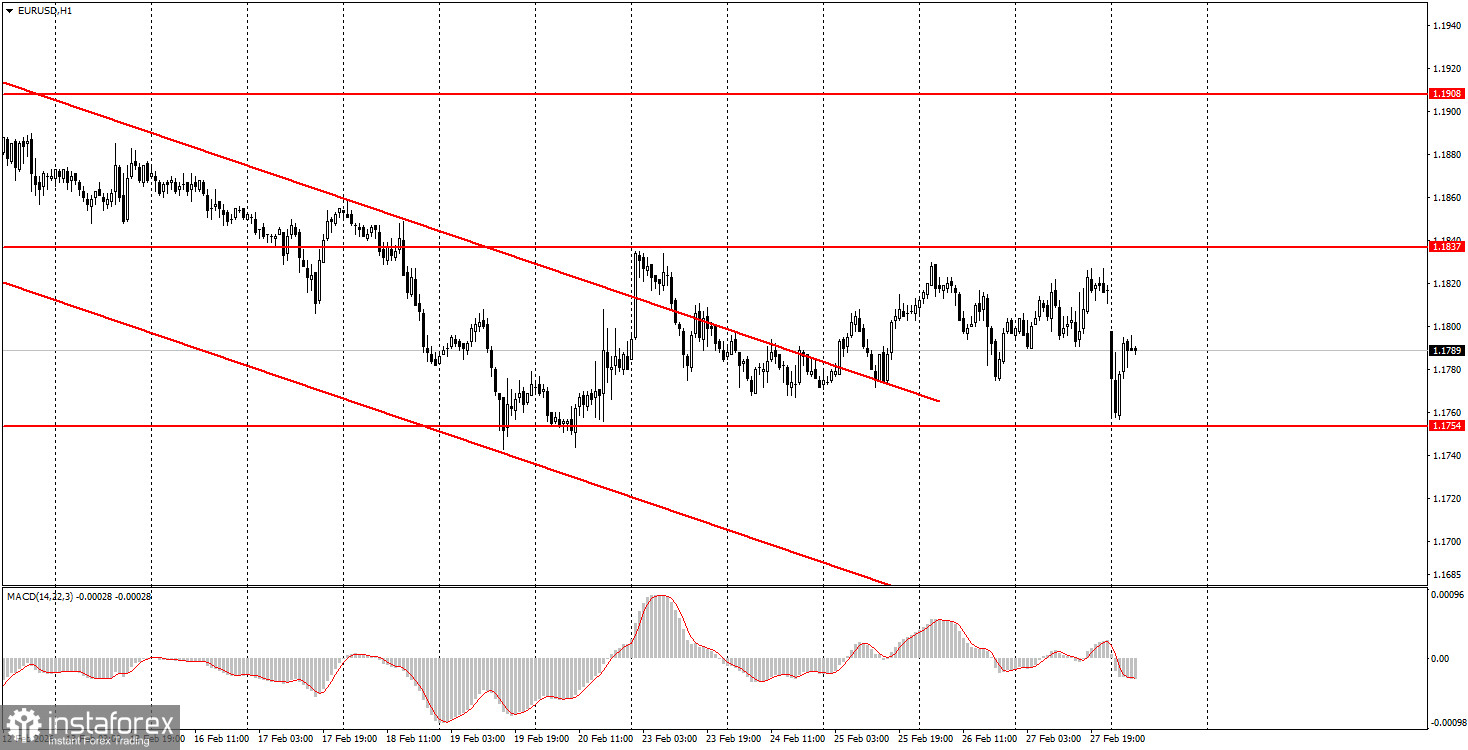
1H Chart of the EUR/USD Pair
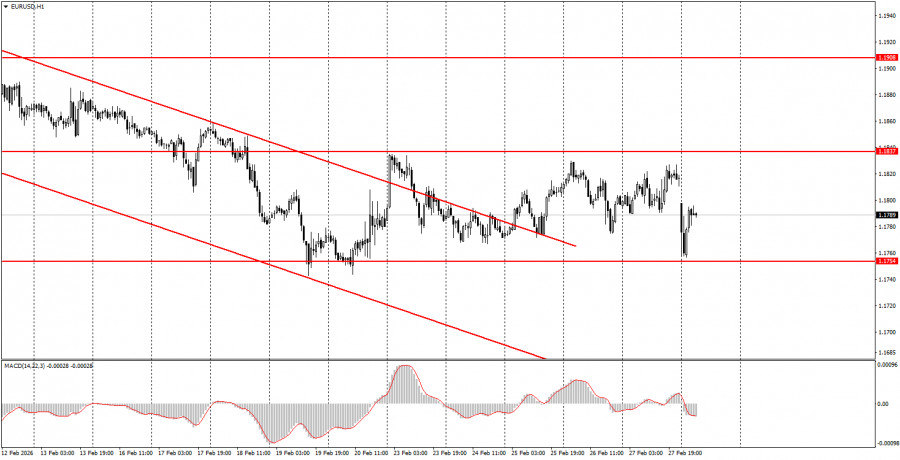
The EUR/USD currency pair traded with minimal volatility on Friday, mostly moving sideways. Even on the hourly timeframe, it is clear that over the past week, the price has traded between 1.1754 and 1.1837. Thus, a sideways channel has formed, and even the events of the past weekend did not help the pair break out of it. Recall that on Saturday, a full-scale military conflict began between Israel, the US, and Iran, into which several other Middle Eastern states have now become involved. Overall, one might have expected the dollar to strengthen on Monday, as worsening geopolitical conditions often lead to increased demand for safe-haven dollars. However, the market's reaction was again weak, just as it had been the previous Monday, when traders had to respond to Donald Trump's new tariffs. The dollar rose by 60 pips but had already lost half of its gains by morning. Thus, we cannot say that the market was surprised by the start of a new war on the political map of the world.
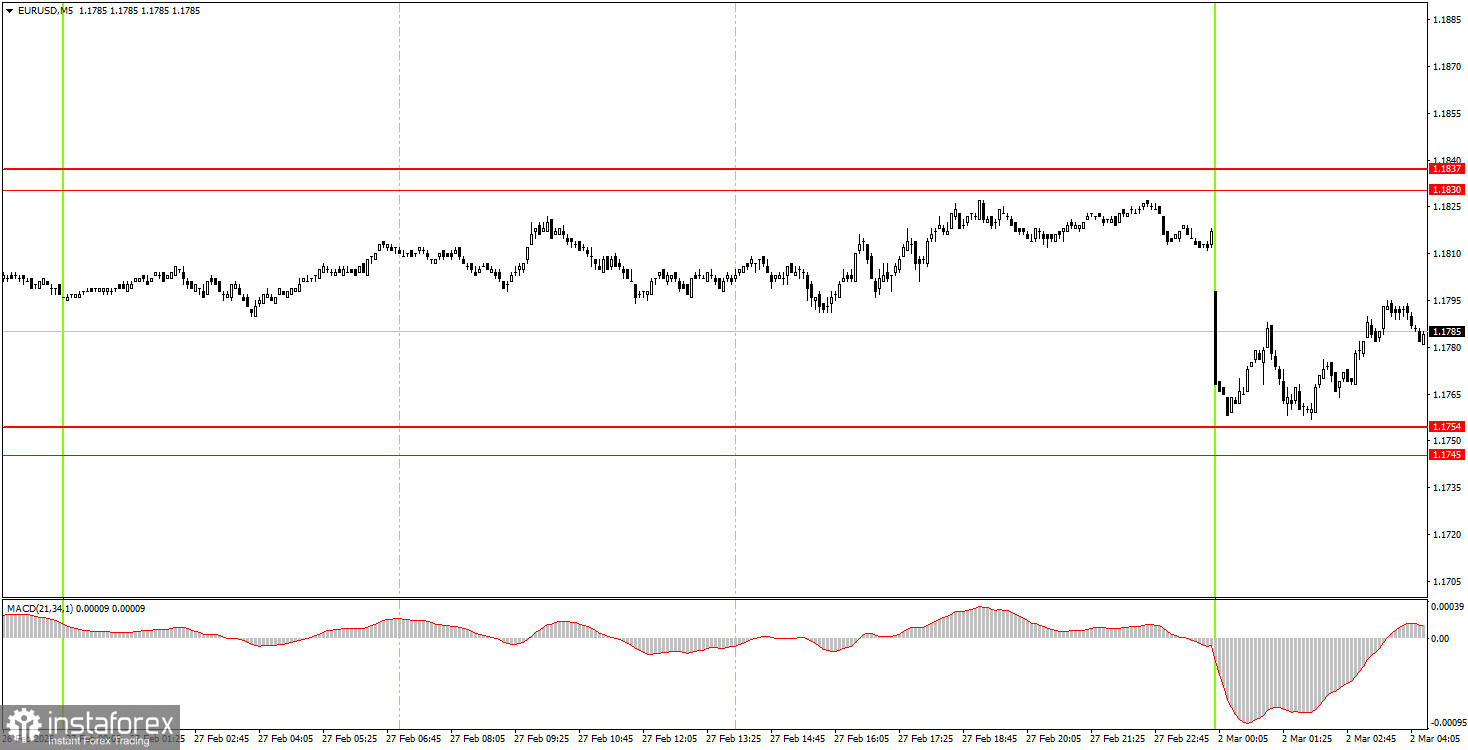
5M Chart of the EUR/USD Pair
On the 5-minute timeframe, no trading signals were formed on Friday. The price approached the area of 1.1830-1.1837 twice, but these approaches occurred late in the evening, just before the market closed for the weekend. Even if signals had formed, they would likely not have been worth trading.
How to Trade on Monday:
On the hourly timeframe, the downward trend has been canceled, as the price has settled above the descending channel. However, instead of an upward trend, we are currently observing a sideways range. At the beginning of 2026, the long-term upward trend has resumed, so we are expecting new medium-term growth for the euro. The overall fundamental background remains very complicated for the US currency, so we fully support further upward movement.
On Monday, novice traders may consider short positions if the price consolidates below the 1.1745-1.1754 range, targeting the 1.1655-1.1666 area. A price bounce from the area of 1.1745-1.1754 will allow for the opening of long positions with a target of 1.1830-1.1837.
On the 5-minute timeframe, the following levels should be considered: 1.1455-1.1474, 1.1527-1.1531, 1.1550, 1.1584-1.1591, 1.1655-1.1666, 1.1745-1.1754, 1.1830-1.1837, 1.1899-1.1908, 1.1970-1.1988, 1.2044-1.2056, and 1.2092-1.2104. On Monday, an important event in the Eurozone will be ECB President Christine Lagarde's speech, while in the US, the more important ISM report on business activity in the manufacturing sector for February will be released. Traders should focus on this latter event. And, of course, do not forget about geopolitics.
Key Principles of the Trading System:
- The strength of a signal is determined by the time it takes to form the signal (bounce or breakout). The less time taken, the stronger the signal.
- If two or more trades have been opened at a particular level based on false signals, all subsequent signals from that level should be ignored.
- In a flat market, any pair can form many false signals or none at all. In any case, at the first signs of a flat trend, it is best to stop trading.
- Trading deals are to be opened during the period between the start of the European session and the mid-American session, after which all trades should be closed manually.
- On the hourly timeframe, it is preferable to trade based on signals from the MACD indicator only when there is good volatility and a trend confirmed by a trend line or trend channel.
- If two levels are positioned too close together (5-20 pips apart), they should be considered a support or resistance area.
- Upon moving 15 pips in the correct direction, a Stop Loss should be set to breakeven.
What to Look for on the Charts:
Price levels of support and resistance are levels that serve as targets when opening buys or sells. Take Profit levels can be placed around them.
Red lines represent channels or trend lines that show the current trend and indicate the direction in which it is preferable to trade now.
The MACD indicator (14,22,3) – the histogram and the signal line – is a supporting indicator that can also be used as a source of signals.
Important speeches and reports (always included in the news calendar) can significantly affect the movement of the currency pair. Therefore, during their release, trading should be done with utmost caution, or traders should exit the market to avoid sharp price reversals against the previous movement.
Beginning traders in the forex market should remember that not every trade can be profitable. Developing a clear strategy and effective money management are the keys to long-term trading success.