empty
31.07.2024 01:35 PM
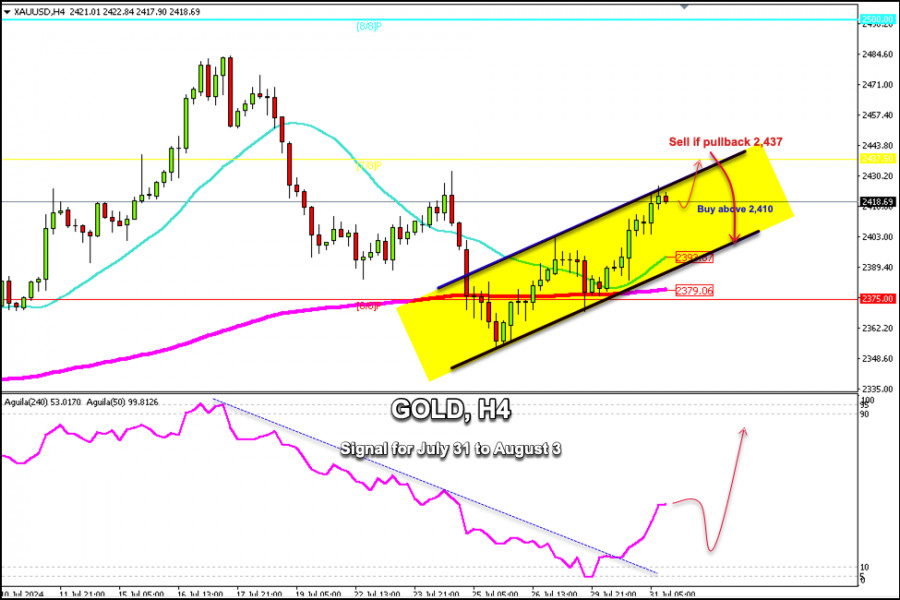
Trading Signals for GOLD (XAU/USD) for July 31 to August 03, 2024: buy above $2,410 (21 SMA - 7/8 Murray)

This image is no longer relevant

Early in the American session, gold is trading around 2,419, within the bullish trend channel forming since July 25, above the 21 SMA, and the 200 EMA, showing a bullish bias. We believe the metal could extend its rise in the coming days.

The Federal Reserve is due to make a policy statement in the next few hours. This high-impact event could generate strong volatility in gold. In case there is a pullback towards 2,437, it will be seen as an opportunity to sell.

On the other hand, if the Fed's rhetoric is bullish for the US dollar, we could expect a drop in the gold price towards the 2,400 area and it could even reach the 21 SMA around 2,393.

Since gold is trading around the top of the uptrend channel, a technical connection is likely to follow. Then, the price may resume its bullish cycle.

On the other hand, if gold continues its rise, there is a strong resistance around 7/8 of Murray. If gold reaches this area, it could be seen as an opportunity to sell below 2,437.

The eagle indicator is showing a positive signal. So, we believe that gold is going to trade higher in the coming days. The key for the XAU is to consolidate above 2,375. Then, any pullback will be seen as a buying opportunity.

Dimitrios Zappas,
InstaForex के विश्लेषणात्मक विशेषज्ञ
© 2007-2025
समय सीमा चुनें
5
मिनट
15
मिनट
30
मिनट
1
घंटा
4
घंटे
1
दिन
1
सप्ताह
Earn on cryptocurrency rate changes with InstaForex
Download MetaTrader 4 and open your first trade
  • Grand Choice
    Contest by
    InstaForex
    InstaForex always strives to help you
    fulfill your biggest dreams.
    कॉन्टेस्ट में हिस्सा लें

अनुशंसित लेख

बिटकॉइन – तकनीकी विश्लेषण

पिछले साल, बुल्स का स्पष्ट दबदबा था, जिन्होंने महत्वपूर्ण बढ़त और उपलब्धियां हासिल कीं। 2024 में, उन्होंने $108,362.36 का नया सर्वकालिक उच्चतम स्तर छू लिया, जो 2021 में स्थापित $68,959.73

Evangelos Poulakis 14:00 2025-01-20 UTC+2

EUR/USD और GBP/USD पर 16 जनवरी का तकनीकी विश्लेषण

कल, जोड़ी ने एक लंबी ऊपरी छाया बनाई, जिसने दैनिक फिबोनाची किजुन स्तर 1.0338 का परीक्षण किया। दिन के अंत तक, बाजार ने 1.0338 से 1.0308 के दैनिक प्रतिरोध स्तरों

Evangelos Poulakis 18:16 2025-01-16 UTC+2

एसएंडपी 500 के इंट्राडे मूल्य आंदोलन का तकनीकी विश्लेषण, गुरुवार 16 जनवरी, 2025।

यदि हम S&P 500 सूचकांक के 4 घंटे के चार्ट को देखें, तो यह देखा जा सकता है कि यह सूचकांक कमजोर पड़ने वाली नीचे की स्थिति में आगे बढ़

Arief Makmur 18:04 2025-01-16 UTC+2

15 जनवरी 2025 को AUD/USD का पूर्वानुमान

ऑस्ट्रेलियाई डॉलर अवरोही मूल्य चैनल की निचली सीमा तक पहुँचने की कोई तत्परता नहीं दिखा रहा है, न ही यह 0.6246 पर ऊपरी सीमा तक पहुँचने की जल्दी में है।

Laurie Bailey 17:47 2025-01-15 UTC+2

15 जनवरी 2025 को GBP/USD का पूर्वानुमान

प्रति घंटा चार्ट पर, GBP/USD जोड़ी मंगलवार को अपनी ऊपर की ओर गति को बढ़ाने या नई गिरावट शुरू करने में विफल रही। 1.2191 के स्तर को व्यापारियों द्वारा काफी

Samir Klishi 17:45 2025-01-15 UTC+2

GBP/USD: 13 जनवरी। पाउंड फ्री फॉल में बना हुआ है

घंटे के चार्ट पर, GBP/USD जोड़ी ने शुक्रवार को 1.2303 पर 261.8% फिबोनाची सुधारात्मक स्तर से हल्का पलटाव किया और अपनी गिरावट जारी रखी। आज, जोड़ी पहले ही 1.2171 स्तर

Samir Klishi 12:23 2025-01-13 UTC+2

EUR/USD: 13 जनवरी। यूरो की गिरावट जारी

शुक्रवार को, EUR/USD जोड़ी ने अपनी गिरावट जारी रखी, 1.0255 पर 127.2% फिबोनाची सुधारात्मक स्तर के नीचे टूट गई। सोमवार को, रातभर यह गिरावट जारी रही और अगले फिबोनाची स्तर

Samir Klishi 12:23 2025-01-13 UTC+2

10-13 जनवरी, 2025 के लिए गोल्ड (XAU/USD) के लिए ट्रेडिंग सिग्नल: $2,695 से नीचे बेचें (21 SMA - 5/8 मरे)

अमेरिकी सत्र की शुरुआत में, सोना 2,660 पर स्थित 21 एसएमए के आसपास मजबूत समर्थन मिलने के बाद तेजी के साथ 2,682 के आसपास कारोबार कर रहा है। सोने को

Dimitrios Zappas 16:53 2025-01-10 UTC+2

9 जनवरी 2025 को EUR/USD का पूर्वानुमान

बुधवार को, EUR/USD जोड़ी 1.0336–1.0346 के समर्थन क्षेत्र से नीचे समेकित हुई और 1.0255 पर 127.2% फिबोनाची सुधारात्मक स्तर की ओर अपनी गिरावट जारी रखी। इस स्तर से पलटाव यूरो

Samir Klishi 18:45 2025-01-09 UTC+2

9 जनवरी 2025 को GBP/USD का पूर्वानुमान

प्रति घंटा चार्ट पर, GBP/USD जोड़ी ने बुधवार को 1.2488-1.2508 क्षेत्र से मामूली उछाल लिया और अपनी गिरावट जारी रखी। दिन के अंत तक, यह 1.2363-1.2370 क्षेत्र से नीचे समेकित

Samir Klishi 18:43 2025-01-09 UTC+2
अभी बात नहीं कर सकते?
अपना प्रश्न पूछें बातचीत.
Widget callback
 

Dear visitor,

Your IP address shows that you are currently located in the USA. If you are a resident of the United States, you are prohibited from using the services of InstaFintech Group including online trading, online transfers, deposit/withdrawal of funds, etc.

If you think you are seeing this message by mistake and your location is not the US, kindly proceed to the website. Otherwise, you must leave the website in order to comply with government restrictions.

Why does your IP address show your location as the USA?

  • - you are using a VPN provided by a hosting company based in the United States;
  • - your IP does not have proper WHOIS records;
  • - an error occurred in the WHOIS geolocation database.

Please confirm whether you are a US resident or not by clicking the relevant button below. If you choose the wrong option, being a US resident, you will not be able to open an account with InstaForex anyway.

We are sorry for any inconvenience caused by this message.