To open long positions on EUR/USD, you need:
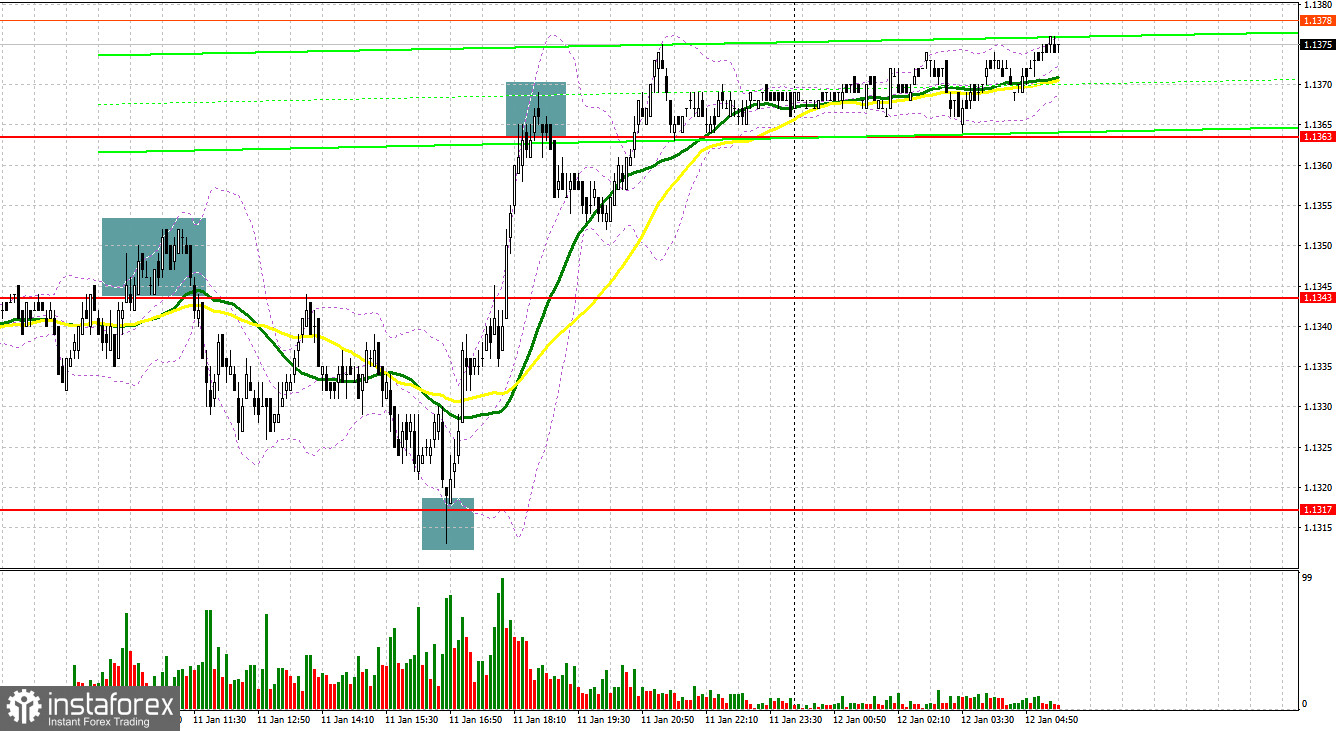
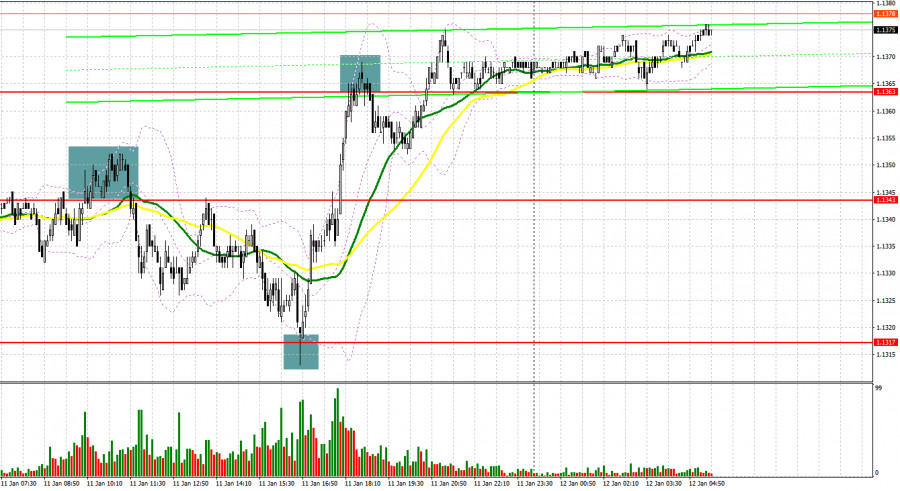
Quite a lot of profitable signals to enter the market were formed yesterday. Let's take a look at the 5 minute chart and see what happened. In my morning forecast, I paid attention to the 1.1343 level and advised you to make decisions on entering the market. Speeches from the European Central Bank did not provide much help to the euro in the first half of the day, however, bulls attempted to break through 1.1343. A false breakout and returning to the area under this level formed an entry point for short positions, which ultimately led to a large sell-off of the pair to the 1.1317 area, allowing it to pull about 25 points of profit along with it. I paid attention to the 1.1317 level in my forecast for the second half of the day, and advised to buy there in case of a false breakout, which happened. As a result, growth to the area of 1.1363 and another +45 points. At the end of the US session, the bears tried to defend the resistance at 1.1363, forming a false break there as well, as a result of which one could observe a small downward correction of the pair by 10 points.
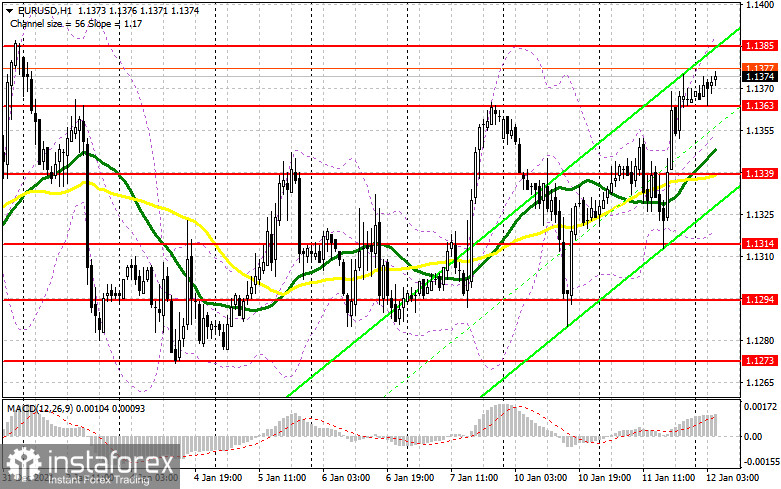
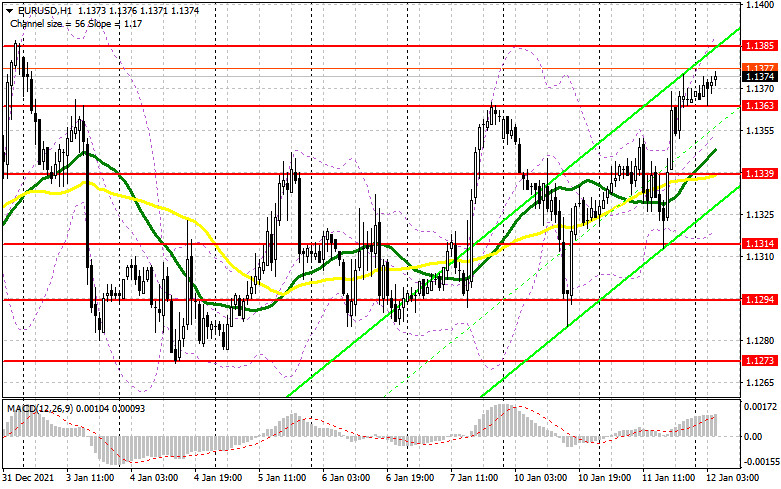
Bulls are gaining strength. Federal Reserve Chairman Jerome Powell's statements from yesterday stating the urgent need for a sharp increase in interest rates has not yet led to an increase in the pair in the afternoon. However, before counting on the EUR/USD to go beyond the horizontal channel and to break through its upper border, bulls need to focus on the level of 1.1326, which was formed at the end of yesterday and just below which the moving averages are, playing on the bulls' side. Forming a false breakout there and good data on changes in the industrial production of the eurozone should lead to a repeated rise in the euro to the area of a high like 1.1385. Surpassing this range is still an important task, and a reverse test from top to bottom will open an opportunity for growth to the levels: 1.1415 and 1.1442, where I recommend taking profits. The 1.1480 level is a more distant target, the test of which will be evidence of the resumption of the bullish trend. If the pair declines during the European session and the bulls are not active at 1.1363, it is best to postpone long positions until the larger support at 1.1339. However, I advise you to open long positions there when a false breakout is formed. You can buy EUR/USD immediately on a rebound from the level of 1.1314 while counting on an upward correction of 20-25 points within the day.
To open short positions on EUR/USD, you need:
The bears risk losing control of the market, especially after the US inflation data, but it is expected in the afternoon. If EUR/USD continues to rise during the European session following a strong industrial production report in the eurozone, the bears should try their best not to miss the 1.1385 resistance - the upper border of the wide horizontal channel formed earlier this year. Growth above this level will lead to a change in the pair's direction and push it out of the horizontal channel. Forming a false breakout at 1.1385 creates the first entry point to short positions in hopes of a return of pressure and a decline to the 1.1363 area. A more active struggle will unfold for this level, since it plays an important role. Moving averages that play on the bulls' side also pass below 1.1363. A breakthrough and test from the bottom up of this range will give another signal to open short positions with the prospect of falling to a large low like 1.1339. Only a breakthrough of this range will slightly change the market direction to a downward trend and take down a number of bulls' stop orders, which will cause EUR/USD to fall to lows like 1.1314 and 1.1294, where I recommend taking profits. If the euro grows and the bears are not active at 1.1385, it is best not to rush to sell. The optimal scenario will be short positions when a false breakout is formed in the 1.1415 area. It is possible to sell EUR/USD immediately on a rebound from the 1.1442 high, or even higher - in the region of 1.1480, while counting on a downward correction of 15-20 points.
I recommend for review:
The Commitment of Traders (COT) report from January 4 revealed a sharp increase in long positions and contraction in short positions that had an impact on the negative delta's value. It indicates that the market is changing its sentiment and demand for EUR has recovered despite the Fed's hawkishness and its shift towards aggressive monetary tightening. The highlight of the week is an inflation report from the US. The US CPI is expected to jump above 7% in December. Investors will revise their portfolios following the inflation report. Fresh evidence of soaring inflation will push the US central bank into raising interest rates sooner than later. Another thing is that the US labor market is improving steadily. In this context, we can reckon that the US regulator might increase interest rates at least 4 times this year. The ECB is going to withdraw its emergency bond-buying program in full in March 2022. However, the regulator does not plan other moves towards tightening its monetary policy. This dovish stance caps the upside potential of risky assets. According to the last COT report, long non-commercial positions grew to 199,073 from 196,595 for the week. At the same time, short non-commercial positions dropped from 206,757 to 200,627. It proves that traders are poised to add long positions on EUR/USD bearing in mind a further upward correction of EUR/USD. By and large, the overall non-commercial net positions declined from -10,162 to -1,554. EUR/USD closed last week a bit higher at 1.1302 against 1.1277 a week ago.
Indicator signals:
Trading is carried out above the 30 and 50 daily moving averages, which indicates an attempt by the bulls to continue the growth of the euro.
Moving averages
Note: The period and prices of moving averages are considered by the author on the H1 hourly chart and differs from the general definition of the classic daily moving averages on the daily D1 chart.
Bollinger Bands
In case of a decline, support will be provided by the lower border of the indicator in the area of 1.1314. Crossing the upper border of the indicator in the 1.1385 area will lead to a new wave of growth for the euro.
Description of indicators
- Moving average (moving average, determines the current trend by smoothing out volatility and noise). Period 50. It is marked in yellow on the chart.
- Moving average (moving average, determines the current trend by smoothing out volatility and noise). Period 30. It is marked in green on the chart.
- MACD indicator (Moving Average Convergence/Divergence — convergence/divergence of moving averages) Quick EMA period 12. Slow EMA period to 26. SMA period 9
- Bollinger Bands (Bollinger Bands). Period 20
- Non-commercial speculative traders, such as individual traders, hedge funds, and large institutions that use the futures market for speculative purposes and meet certain requirements.
- Long non-commercial positions represent the total long open position of non-commercial traders.
- Short non-commercial positions represent the total short open position of non-commercial traders.
- Total non-commercial net position is the difference between short and long positions of non-commercial traders.