To open long positions on EURUSD, you need:
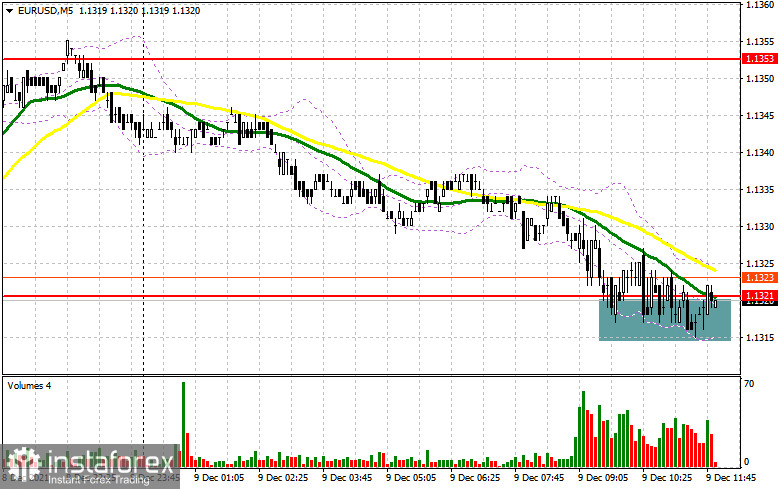
In my morning forecast, I paid attention to the level of 1.1321 and recommended making decisions on entering the market. Let's look at the 5-minute chart and figure out what happened. As a result of the absence of important fundamental statistics, and the data on Germany did not lead to a serious surge in volatility, buyers of the European currency focused on protecting the support of 1.1321. The formation of a false breakdown at this level led to a good signal to open long positions in continuation of the upward trend observed yesterday. Until the moment when trading is conducted above 1.1321, we can count on the pair's recovery and a return to the highs of the day. From a technical point of view, nothing has changed.
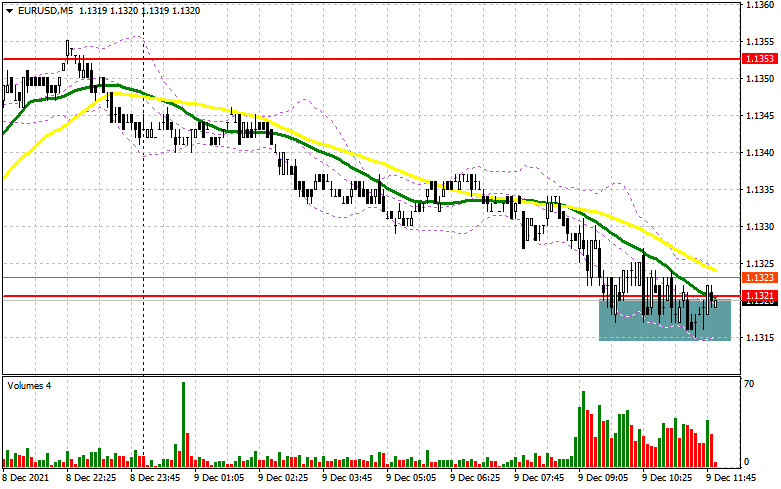
There are no important fundamental statistics in the afternoon, and data on the American labor market is unlikely to cause a "rustle" in the market. If the bulls prove themselves and manage to push up from 1.1321, then this may lead to a larger increase in the euro to the area of 1.1353. A breakout and consolidation above this level, as well as a top-down test – all this will give an excellent entry point into purchases to return to the area of a fairly large maximum of 1.1381, which acts as the upper boundary of a wide side channel. The pair has been in it since November 30. Its breakdown can seriously affect the EUR/USD downward trend, so be very careful at this level. A breakout and a top-down test of 1.1381 will lead to a larger increase in the area of the highs: 1.1415 and 1.1442. A more distant target will be the 1.1480 level, where I recommend fixing the profits. If the pressure on the euro persists in the afternoon and we do not see an active growth from the level of 1.1321, it is best to postpone purchases to larger support of 1.1297. But even there, only the formation of a false breakdown forms a convenient entry point into purchases. I advise you to open long positions immediately for a rebound from the minimum of 1.1270, or even lower - around 1.1238 with the aim of an upward correction of 20-25 points within the day.
To open short positions on EURUSD, you need:
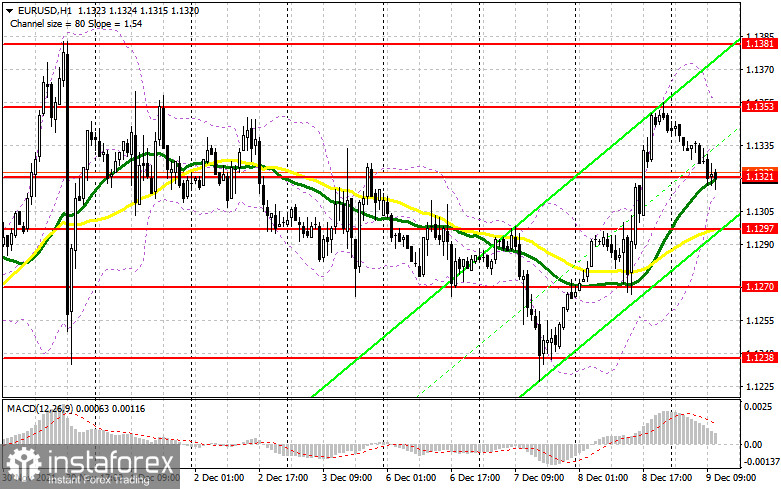
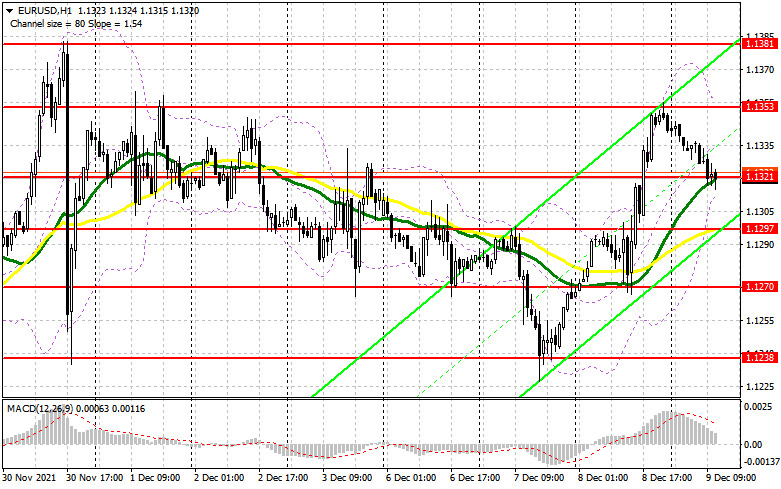
Sellers are gradually returning to the market after yesterday's bullish enthusiasm quickly dried up near the large resistance of 1.1353. Unfortunately, it was not possible to get a false breakdown at this level today, but it was possible to push the euro into the support area of 1.1321, which sellers are now focused on. An important task of the bears is to regain control over this level, just below which the moving averages are playing on the buyers' side. You can act by analogy with yesterday, only in the opposite direction: a breakdown and a test from the bottom up of 1.1321 will lead to the formation of a signal to open short positions with the prospect of a decline in the area of 1.1297. A more distant goal will be the support of 1.1270, where I recommend fixing the profits. In the afternoon, weekly data on the US labor market is released, and in the case of a larger increase in applications, the euro may partially compensate for losses against the US dollar. In the case of recovery of the pair, it is possible to sell only when a false breakdown is formed at 1.1353. It may well be that the bears will release the market for a larger entry from the "last hope level" - 1.1381. The optimal scenario will be short positions when forming a false breakdown in the area of 1.1381. It is possible to sell EUR/USD immediately on a rebound from the highs: 1.1415 and 1.1442 with the aim of a downward correction of 15-20 points.
The COT report (Commitment of Traders) for November 30 recorded a decrease in both short and long positions. However, the reduction of long positions remained higher, which led to an increase in the negative delta. Last week, there were a lot of speeches by the Chairman of the Federal Reserve System, Jerome Powell, who in his comments spoke enough about the expected changes in monetary policy towards its tightening. The reason for this is rather high inflation, which has grown from "temporary" to permanent, which creates many problems for the central bank. The second problem was the new strain of the omicron coronavirus, which will slow down the global economy at the end of this and early next year, which also restrains the demand for risky assets from buyers. Next week, we will have a meeting of the Federal Reserve System, at which a decision will be made on the bond purchase program, so demand for the US dollar is expected to remain in the shorter term. The latest November COT report indicated that long non-profit positions declined from the level of 204,214 to the level of 191,048, while short non-profit positions fell from the level of 220,666 to the level of 214,288. At the end of the week, the total non-commercial net position increased to -23,240 versus -16,452. The weekly closing price, on the contrary, rose much to 1.1292 against 1.1241.
Signals of indicators:
Moving averages
Trading is conducted above 30 and 50 daily moving averages, which indicates the struggle of buyers for the market.
Note: The period and prices of moving averages are considered by the author on the hourly chart H1 and differ from the general definition of the classic daily moving averages on the daily chart D1.
Bollinger Bands
A breakthrough of the lower limit of the indicator in the area of 1.1310 will increase the pressure on the pound. In the case of growth, the upper limit of the indicator around 1.3155 will act as resistance.
Description of indicators
- Moving average (moving average determines the current trend by smoothing out volatility and noise). Period 50. The graph is marked in yellow.
- Moving average (moving average determines the current trend by smoothing out volatility and noise). Period 30. The graph is marked in green.
- MACD indicator (Moving Average Convergence / Divergence - moving average convergence/divergence) Fast EMA period 12. Slow EMA period 26. SMA period 9
- Bollinger Bands (Bollinger Bands). Period 20
- Non-profit speculative traders, such as individual traders, hedge funds, and large institutions that use the futures market for speculative purposes and meet certain requirements.
- Long non-commercial positions represent the total long open position of non-commercial traders.
- Short non-commercial positions represent the total short open position of non-commercial traders.
- Total non-commercial net position is the difference between the short and long positions of non-commercial traders.