To open long positions on EUR/USD, you need:
Yesterday there were a lot of signals to enter the market, but the main downward movement was not captured. Due to low volatility, no normal entry point was formed. Let's take a look at the 5-minute chart and break down the trades. Formation of a false breakout at the level of 1.1766 in the first half of the day resulted in creating a signal to open long positions, after which the pair rushed up to the resistance of 1.1783 and that was all. Failure to settle above 1.1783 and the data on the eurozone GDP, which coincided with the forecasts of economists, had created a signal to sell the euro, and then the pair returned to the 1.1766 area, where a signal to buy the euro was again formed. All the emphasis was on the US data. And although they turned out to be much worse than the forecasts of economists, this did not affect the US dollar in any way, but only strengthened its position, which led to a loss on long positions from 1.1766.
Today the focus will be shifted to inflation data in the eurozone, but as practice shows, the market is unlikely to react to them in any way, which can keep the bearish trend in EUR/USD. The initial task is to regain control of the resistance at 1.1728, the test of which from top to bottom can create a signal to buy the euro as we aim for 1.1745, where the moving averages that play on the bears' side are passing. Surpassing this area, along with strong eurozone inflation data, may provoke an upward correction to the resistance area of 1.1769, where I recommend taking profits. The next task will be to update 1.1799, which will be a clear signal for forming a new bullish trend. In case EUR/USD falls in the first half of the day, a serious task is to protect the support at 1.1699, slightly below which divergence may form on the MACD indicator, playing on the side of the bulls. You can open long positions only when a false breakout is formed there. In case EUR/USD falls during the European session and the bulls are not active in the 1.1699 area, I advise you to wait for an update at 1.1673, or buy EUR/USD immediately on a rebound from the 1.1630 support, counting on an upward correction of 15-20 points within the day.
To open short positions on EUR/USD, you need:
The bears have taken control of the market and now aim to surpass monthly lows.
The one thing that can prevent them in the first half of the day is the formation of a divergence after failing to settle below 1.1699. Only a breakthrough and a reverse test of this level from the bottom up will increase the pressure on the pair and generate a signal to sell the euro in hopes of renewing new lows: 1.1673 and 1.1630, where I recommend taking profits. We can expect the euro to fall even if the eurozone inflation report turns out to be worse than economists' forecasts. The next target will be the area of 1.1604. In the event of a further upward correction, which we observe in today's Asian session, a false breakout at the level of 1.1728 creates the first signal to open short positions in hopes that the bear market would return. In case EUR/USD grows during the European session and the bulls are not active at 1.1728, it is best to postpone selling until the test of the larger resistance at 1.1745. You can also open short positions there only after the formation of a false breakout. I advise to sell the pair immediately on a rebound counting on a downward correction of 15-20 points only from a high like 1.1769.
In the Commitment of Traders (COT) report for August 10, there is a clear increase in traders' interest in the market, as both long and short positions increased, but the latter turned out to be more, which led to a reduction in the positive delta. Last week, many traders focused on the consumer price index of the United States of America, which has slowed after record growth rates and in line with economists' forecasts. This seriously influenced the desire of traders to buy the US dollar in anticipation of the imminent changes in the bank's monetary policy. Given these inflationary surges, the Federal Reserve can be expected to slow down the changes in the bond buying program that many investors were counting on as early as September this year. Accordingly, this will weaken the dollar's position. But you shouldn't think that against this background the euro will sharply rise. The lack of benchmarks due to the new strain of the Delta coronavirus and the incomprehensible reaction of the European economy to it - all this will force the European Central Bank to continue to adhere to a wait-and-see attitude and maintain a stimulating policy at current levels, and this negatively affects the euro. Therefore, all that remains is to look at small surges of volatility within the day - at least this state of the market will be until the fall of this year. The COT report indicated that long non-commercial positions rose from 199,067 to 212,809, while short non-commercial positions jumped from 161,060 to 178,952. By the end of the week, the total non-commercial net position decreased from 38,007 to the level of 33 857. The weekly closing price also dropped from 1.1874 to 1.1736.
Indicator signals:
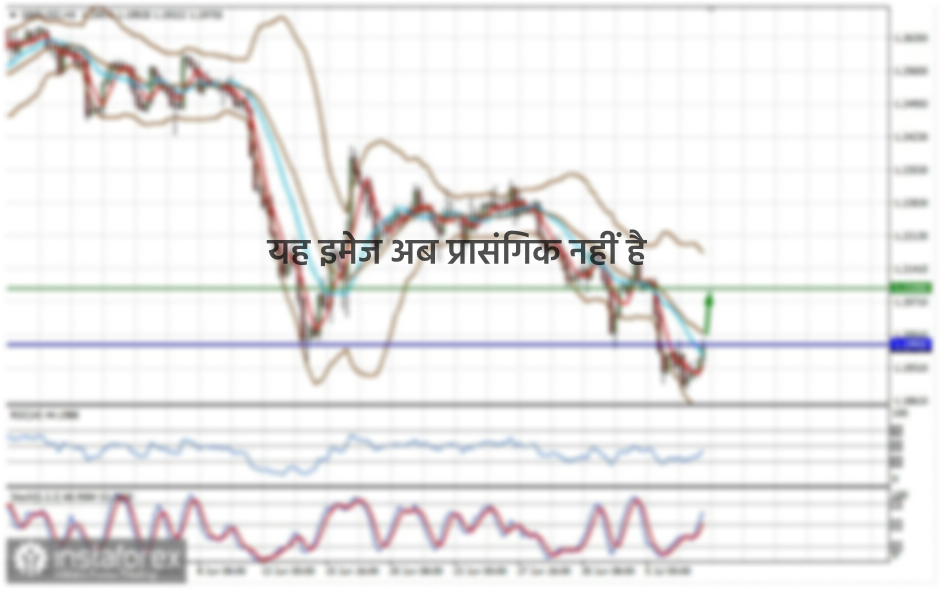
Trading is under the 30 and 50 moving averages, which indicates a resumption of the bear market.
Moving averages
Note: The period and prices of moving averages are considered by the author on the H1 hourly chart and differs from the general definition of the classic daily moving averages on the daily D1 chart.
Bollinger Bands
If the pair grows, the upper border of the indicator in the area of 1.1769 will act as a resistance. In case the pair falls, support will be provided by the lower border at 1.1685.
Description of indicators
- Moving average (moving average, determines the current trend by smoothing out volatility and noise). Period 50. It is marked in yellow on the chart.
- Moving average (moving average, determines the current trend by smoothing out volatility and noise). Period 30. It is marked in green on the chart.
- MACD indicator (Moving Average Convergence/Divergence — convergence/divergence of moving averages) Quick EMA period 12. Slow EMA period to 26. SMA period 9
- Bollinger Bands (Bollinger Bands). Period 20
- Non-commercial speculative traders, such as individual traders, hedge funds, and large institutions that use the futures market for speculative purposes and meet certain requirements.
- Long non-commercial positions represent the total long open position of non-commercial traders.
- Short non-commercial positions represent the total short open position of non-commercial traders.
- Total non-commercial net position is the difference between short and long positions of non-commercial traders.


