Trade Analysis for Wednesday:
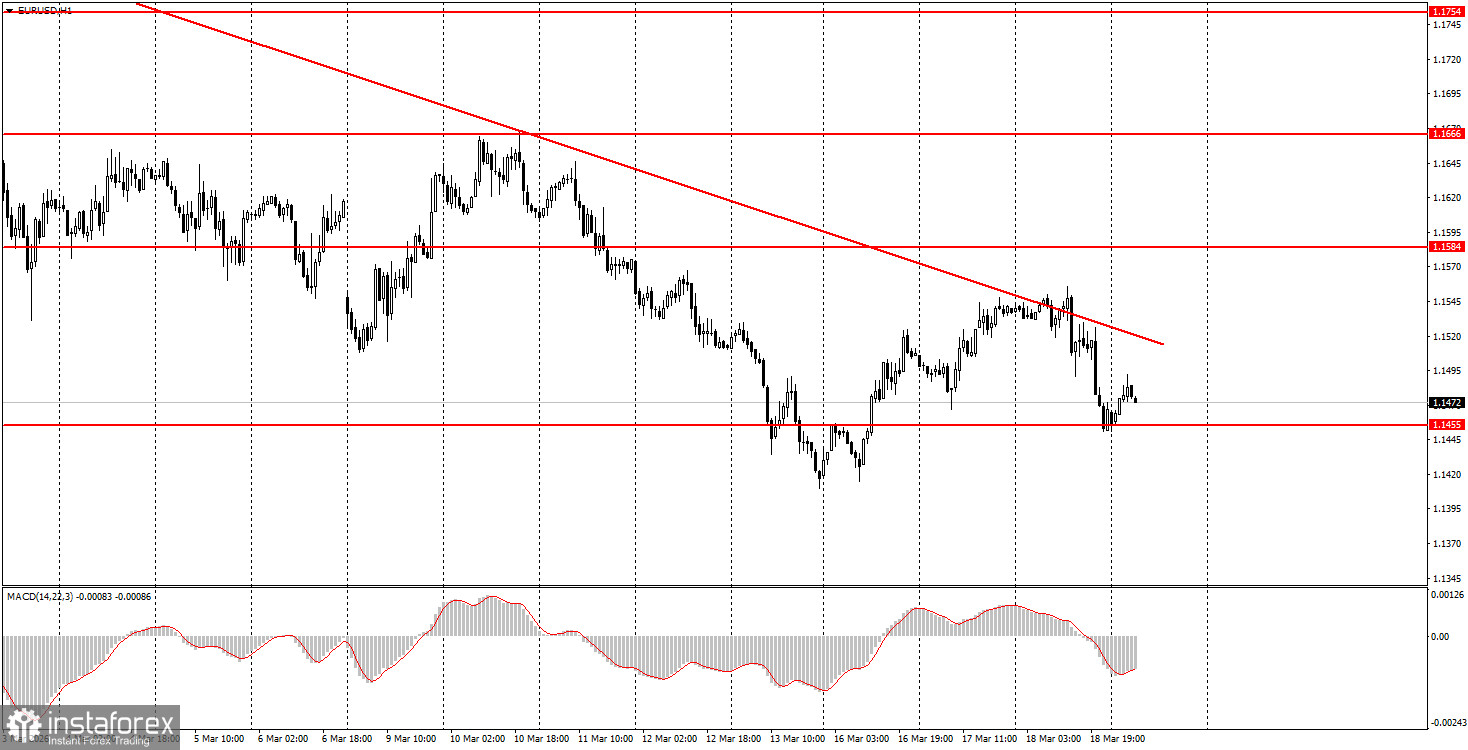
1H Chart of the EUR/USD Pair
The EUR/USD currency pair traded lower again on Wednesday, influenced by two objective reasons. Firstly, the Producer Price Index (PPI) showed higher values than the markets expected (though we do not consider it a major indicator). Secondly, the Fed took a more hawkish stance than in its previous meeting and at the end of 2026. What does this indicate? It suggests that the Fed expects accelerating inflation (as indirectly warned by the PPI and the conflict in the Middle East), so it is not prepared to engage in monetary easing anytime soon. Even Jerome Powell's departure from the position of Fed chair is unlikely to change anything, as most members of the Federal Reserve oppose a rate cut. These two factors provided additional support to the US dollar. Meanwhile, oil prices continue to climb inexorably, and although the conflict in the Middle East has lost some intensity, it continues. Thus, the dollar may continue to rise regardless of the situation.
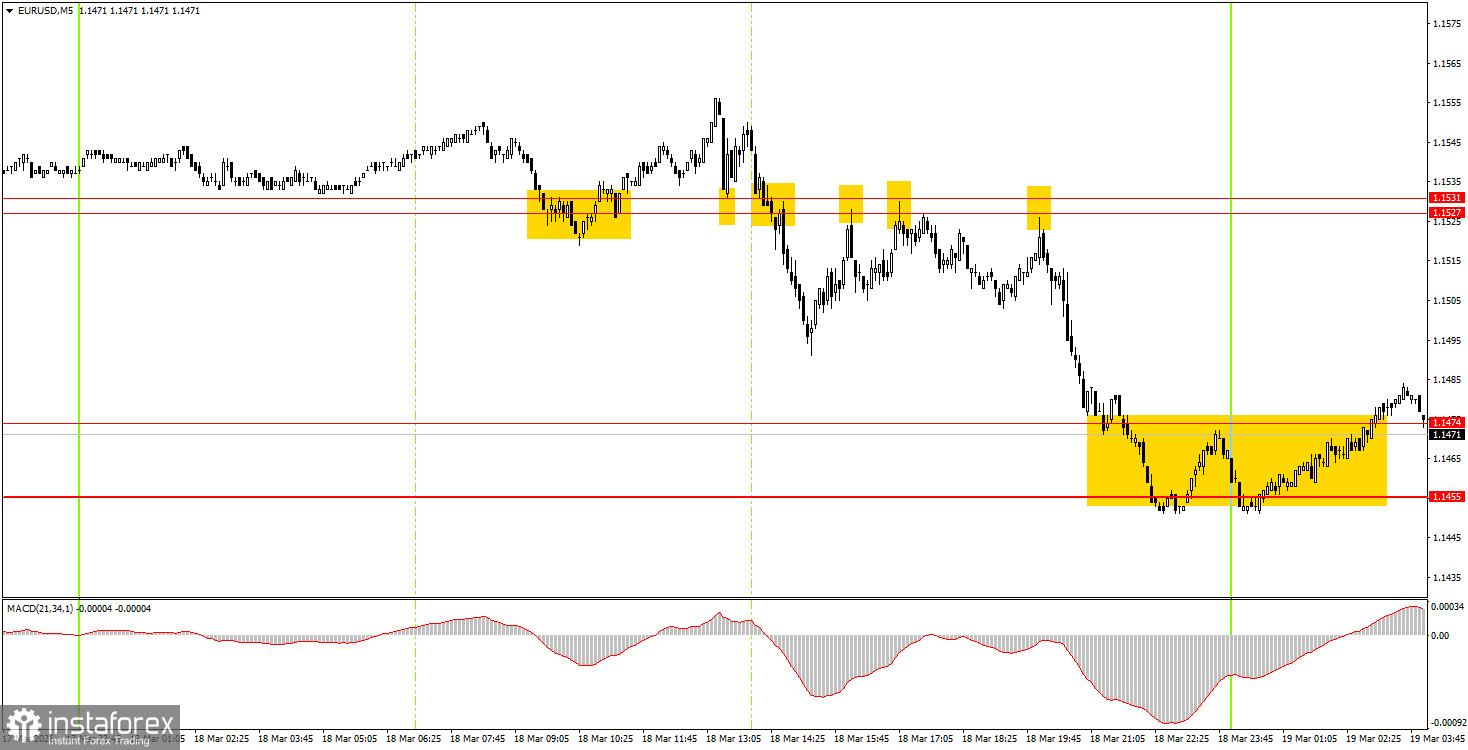
5M Chart of the EUR/USD Pair
On the 5-minute time frame, a significant number of signals were formed on Wednesday around the area of 1.1527-1.1531, confirming its strength and significance. Initially, the price bounced off this area from the top twice; however, both signals proved false. Following that, the price broke through and subsequently bounced three times from below, provoking a drop in the European currency to the area of 1.1455-1.1474. Thus, not all trades that beginner traders could have opened were profitable, but overall, the signals were not the worst.
How to Trade on Thursday:
On the hourly time frame, the downward trend is sustained by the Middle Eastern war, and the Fed has provided a foothold for the dollar to rise again. A long-term upward trend resumed at the beginning of 2026, so we still expect another medium-term rise in the euro. The overall fundamental background remains quite challenging for the US dollar, as confirmed by reports on the labor market, GDP, and unemployment. However, geopolitics and inflation are the primary concerns for the market at this time.
On Thursday, beginner traders may consider new short positions if the price consolidates below the 1.1455-1.1474 area, with targets at 1.1413 and 1.1354-1.1363. A bounce from the area of 1.1455-1.1474 will allow for opening long positions with a target of 1.1527-1.1531.
On the 5-minute time frame, the following levels should be considered: 1.1267-1.1292, 1.1354-1.1363, 1.1413, 1.1455-1.1474, 1.1527-1.1531, 1.1584-1.1591, 1.1655-1.1666, 1.1745-1.1754, 1.1830-1.1837, and 1.1899-1.1908. On Thursday, the Eurozone will announce the results of the European Central Bank meeting, and the ECB's stance may be more hawkish, similar to the Fed's stance a day earlier. Therefore, the euro may look set to strengthen, but it is unclear whether the market will respond to signals of a falling dollar.
Key Principles of the Trading System:
- The strength of a signal is determined by the time it takes to form the signal (bounce or breakout). The less time taken, the stronger the signal.
- If two or more trades have been opened at a particular level based on false signals, all subsequent signals from that level should be ignored.
- In a flat market, any pair can form many false signals or none at all. In any case, at the first signs of a flat trend, it is best to stop trading.
- Trading deals are to be opened during the period between the start of the European session and the mid-American session, after which all trades should be closed manually.
- On the hourly timeframe, it is preferable to trade based on signals from the MACD indicator only when there is good volatility and a trend confirmed by a trend line or trend channel.
- If two levels are positioned too close together (5-20 pips apart), they should be considered a support or resistance area.
- Upon moving 15 pips in the correct direction, a Stop Loss should be set to breakeven.
What to Look for on the Charts:
Price levels of support and resistance are levels that serve as targets when opening buys or sells. Take Profit levels can be placed around them.
Red lines represent channels or trend lines that show the current trend and indicate the direction in which it is preferable to trade now.
The MACD indicator (14,22,3) – the histogram and the signal line – is a supporting indicator that can also be used as a source of signals.
Important speeches and reports (always included in the news calendar) can significantly affect the movement of the currency pair. Therefore, during their release, trading should be done with utmost caution, or traders should exit the market to avoid sharp price reversals against the previous movement.
Beginning traders in the forex market should remember that not every trade can be profitable. Developing a clear strategy and effective money management are the keys to long-term trading success.