Analyzing Wednesday's trades:
GBP/USD on 1H chart
GBP/USD has reversed back lower, similar to Tuesday, and it managed to rise by 100 pips. The British pound increased on robust UK PMIs, but the U.S. PMI data did not turn out to be any worse either. In both cases, the values surpassed the forecasts, but U.S. indices turned out to be stronger. Nevertheless, the pound traded higher, and once the U.S. reports were released, the dollar only added 20-30 pips. In other words, it showed a purely formal growth.
Therefore, the pair's upward movement immediately resumed after the price bounced from the lower boundary of the sideways channel of 1.2611-1.2787. The previous day's decline would have confused beginners, but we already warned you that the pair's movements could turn out to be completely random when the pair is within the sideways channel. For instance, the pound sharply dropped on Tuesday for no apparent reason, and on Wednesday, we witnessed a fairly illogical rise. The pair has almost worked through the level of 1.2787, and we can expect a bearish reversal near this mark and the price could return to moving towards 1.2611.
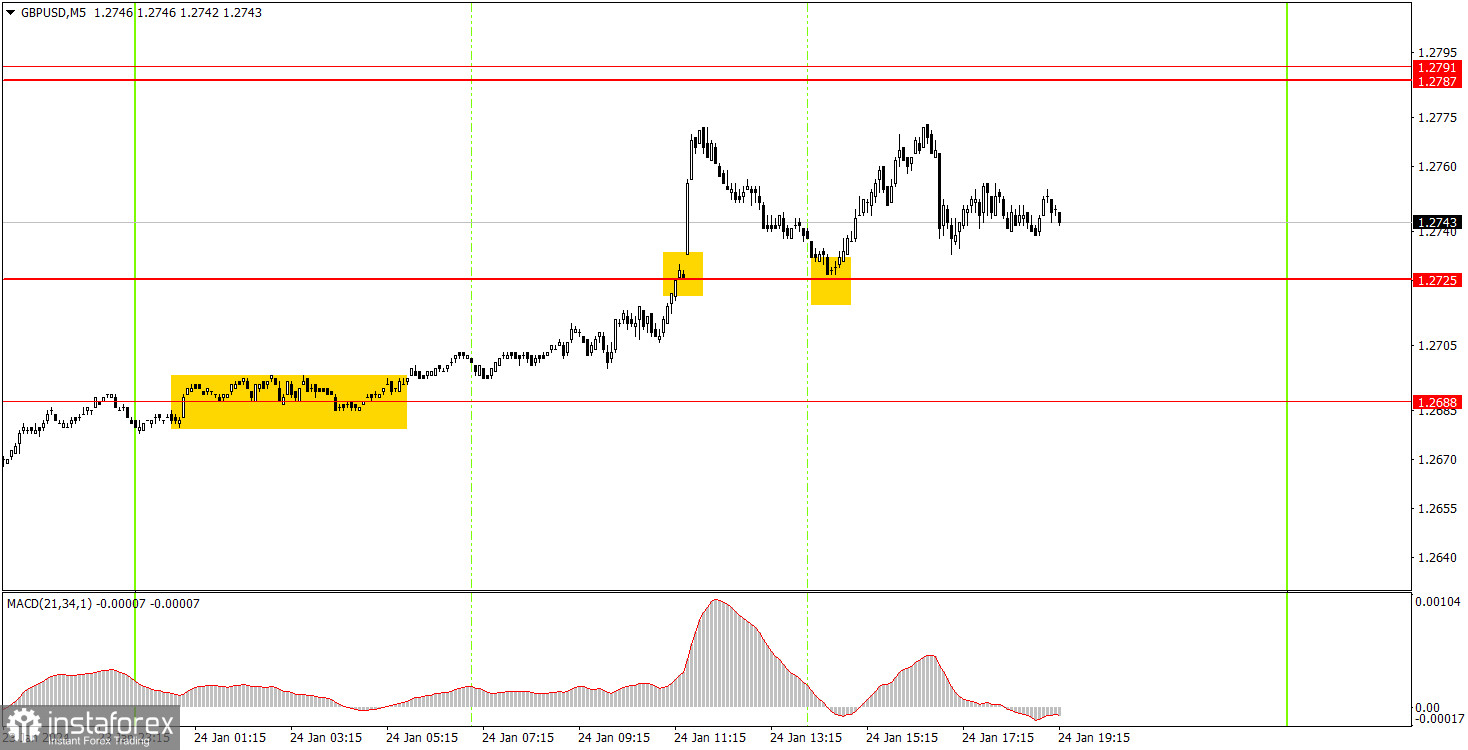
GBP/USD on 5M chart
On Wednesday, the 5-minute timeframe showed quite volatile movements, but it was quite confusing. The first buy signal around the level of 1.2688 was formed overnight, but by the opening of the European session, the price had only moved a few pips away from the point of formation, making it challenging to enter the trade. Then there was a breakthrough of the 1.2725 level, a return to it, a bounce, and a new attempt to rise towards the target of 1.2787, which ended in failure, just like the first one. However, traders could remain in long positions since there were no sell signals. This trade could be manually closed in the evening, resulting in a profit of about 45 pips.
Trading tips on Thursday:
On the hourly chart, GBP/USD is still trading within the sideways channel of 1.2611-1.2787. The price bounced off the level of 1.2611 five times, and after the last bounce, a new uptrend has started within the flat. Since the price is already near the upper boundary of the sideways channel, we can expect a bearish reversal and movement towards the lower boundary.
On Thursday, the British pound will likely remain within the confines of the sideways channel. If the price rebounds from the area of 1.2787-1.2791, it will be a very good sell signal to work with. If the pair breaches this area, technically, we can consider this a buy signal, but it is difficult to expect that the pound would rise further.
The key levels on the 5M chart are 1.2270, 1.2310, 1.2372-1.2387, 1.2457, 1.2502, 1.2544, 1.2605-1.2611, 1.2688, 1.2725, 1.2787-1.2791, 1.2848-1.2860, 1.2913, 1.2981-1.2993. No significant events are scheduled for the UK. From the U.S. docket, we can look forward to important reports on GDP in the fourth quarter and orders for durable goods. The dollar is gradually rising, so even positive reports may not provide strong support.
Basic trading rules:
1) Signal strength is determined by the time taken for its formation (either a bounce or level breach). A shorter formation time indicates a stronger signal.
2) If two or more trades around a certain level are initiated based on false signals, subsequent signals from that level should be disregarded.
3) In a flat market, any currency pair can produce multiple false signals or none at all. In any case, the flat trend is not the best condition for trading.
4) Trading activities are confined between the onset of the European session and mid-way through the U.S. session, after which all open trades should be manually closed.
5) On the 30-minute timeframe, trades based on MACD signals are only advisable amidst substantial volatility and an established trend, confirmed either by a trendline or trend channel.
6) If two levels lie closely together (ranging from 5 to 15 pips apart), they should be considered as a support or resistance zone.
How to read charts:
Support and Resistance price levels can serve as targets when buying or selling. You can place Take Profit levels near them.
Red lines represent channels or trend lines, depicting the current market trend and indicating the preferable trading direction.
The MACD(14,22,3) indicator, encompassing both the histogram and signal line, acts as an auxiliary tool and can also be used as a signal source.
Significant speeches and reports (always noted in the news calendar) can profoundly influence the price dynamics. Hence, trading during their release calls for heightened caution. It may be reasonable to exit the market to prevent abrupt price reversals against the prevailing trend.
Beginners should always remember that not every trade will yield profit. Establishing a clear strategy coupled with sound money management is the cornerstone of sustained trading success.