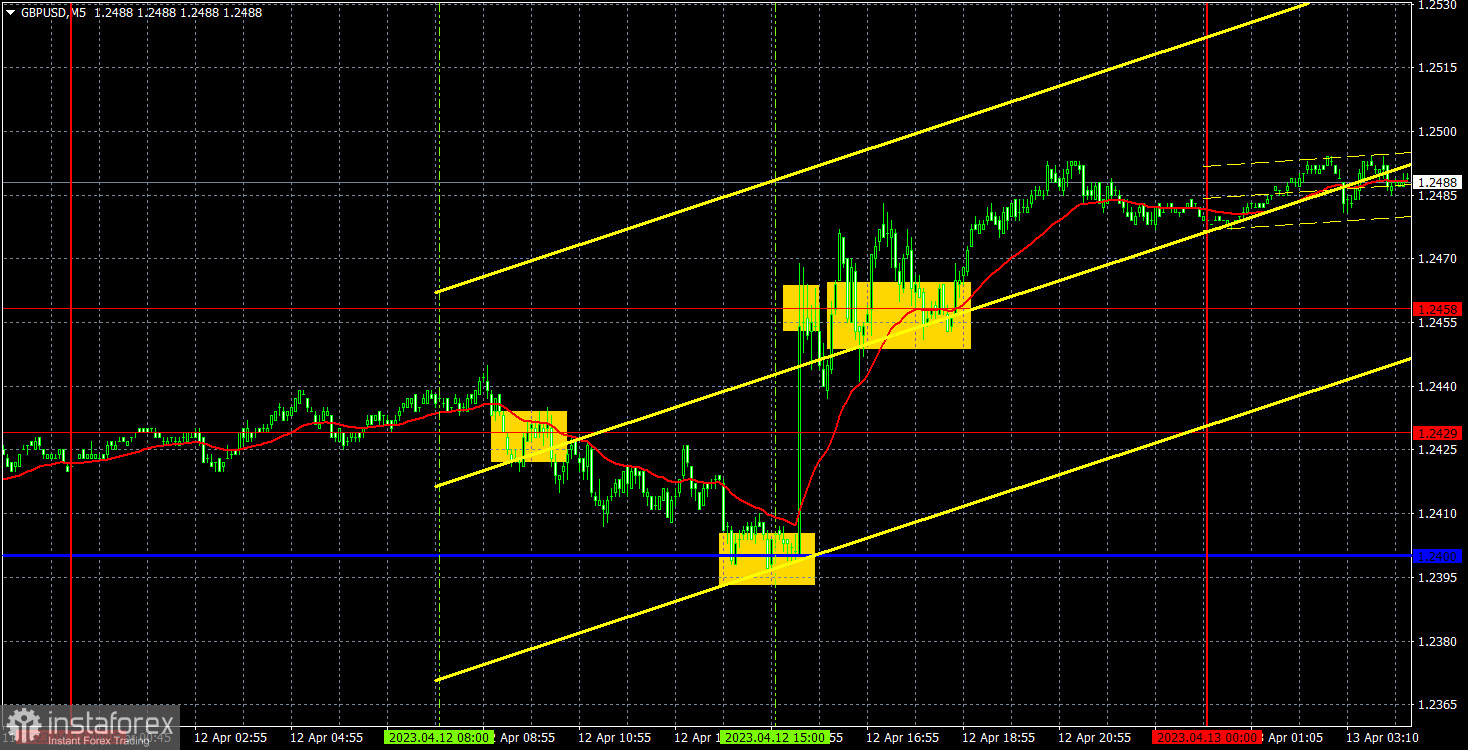
5M chart of GBP/USD
The GBP/USD currency pair traded in a similar manner to the EUR/USD pair on Wednesday. The only difference was that the pound experienced a bit of a bearish correction during the European trading session. However, in the second part of the day, GBP traded higher due to the US inflation report, since interpreted this report as something unfavorable for the dollar. I have already mentioned that the Federal Reserve could pay more attention to the core inflation indicator in the near future, which has started to grow again. At the same time, take note that the dollar's decline based on a 1% decrease in the core inflation rate can also be considered logical. Therefore, yesterday, the market had a good reason to sell the greenback. The problem is that the dollar has been falling for a month now, and sometimes for no reason at all. Also, the pair hasn't been able to enter a bearish correction for quite some time.
The trading signals were quite good. First, a sell signal was formed around the 1.2429 level, afterwards the pair fell to the Kijun-sen line. Traders could have earned no more than 10 points on the short position. Traders were quite lucky with the buy signal near the critical line, since it formed just half an hour before the release of the US inflation report, afterwards the main movement of the day began. Traders were active around the 1.2458 level, and it was important to remain calm since the market was in an excited state. They could have opened a position around this level based on a false sell signal, but there was only one of this, and the rest were profitable.
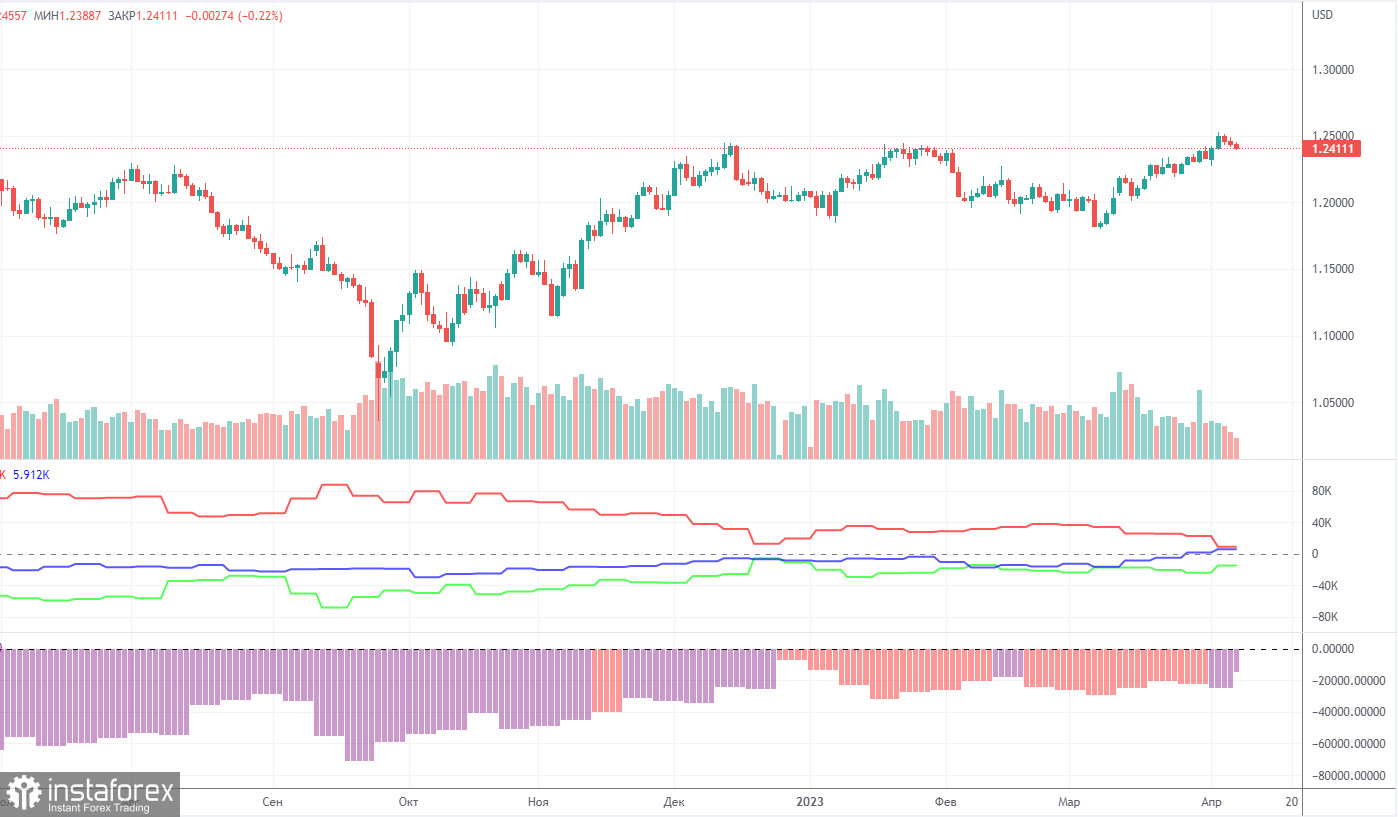
COT report:
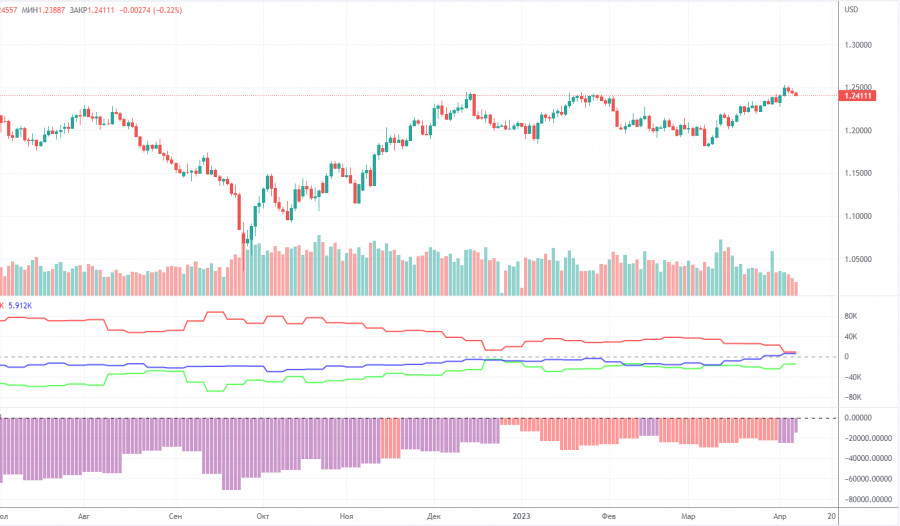
COT reports for the British pound are again released in due time. The latest available report is for April 4th. According to this report, the Non-commercial group opened 18,000 long positions and also opened 8,800 short positions. As a result, the net position of non-commercial traders increased by 9,200 and continues to grow. The net position indicator has been steadily growing for the past 7-8 months, but the sentiment of major players remains bearish. Although the pound sterling is growing against the US dollar in the medium term, it is very difficult to figure out the reasons for the sterling's rally from a fundamental point of view. We absolutely do not exclude the scenario in which a sharper drop in the pound will begin in the short term. Formally, it has already started, but so far this movement looks more like a flat market. We also note that both major pairs are currently following roughly the same pattern, but the net position for the euro is positive and even implies a soon-to-be-ending upward impulse, while for the pound, it is negative, which suggests further growth. The British currency has already rallied by 2,100 points. It is stunning growth without a strong downward correction, so a further rally will be absolutely illogical. The non-commercial group now holds a total of 61,000 shorts and 46,000 longs open. We are still skeptical about the long-term uptrend of the British currency and expect it to fall.
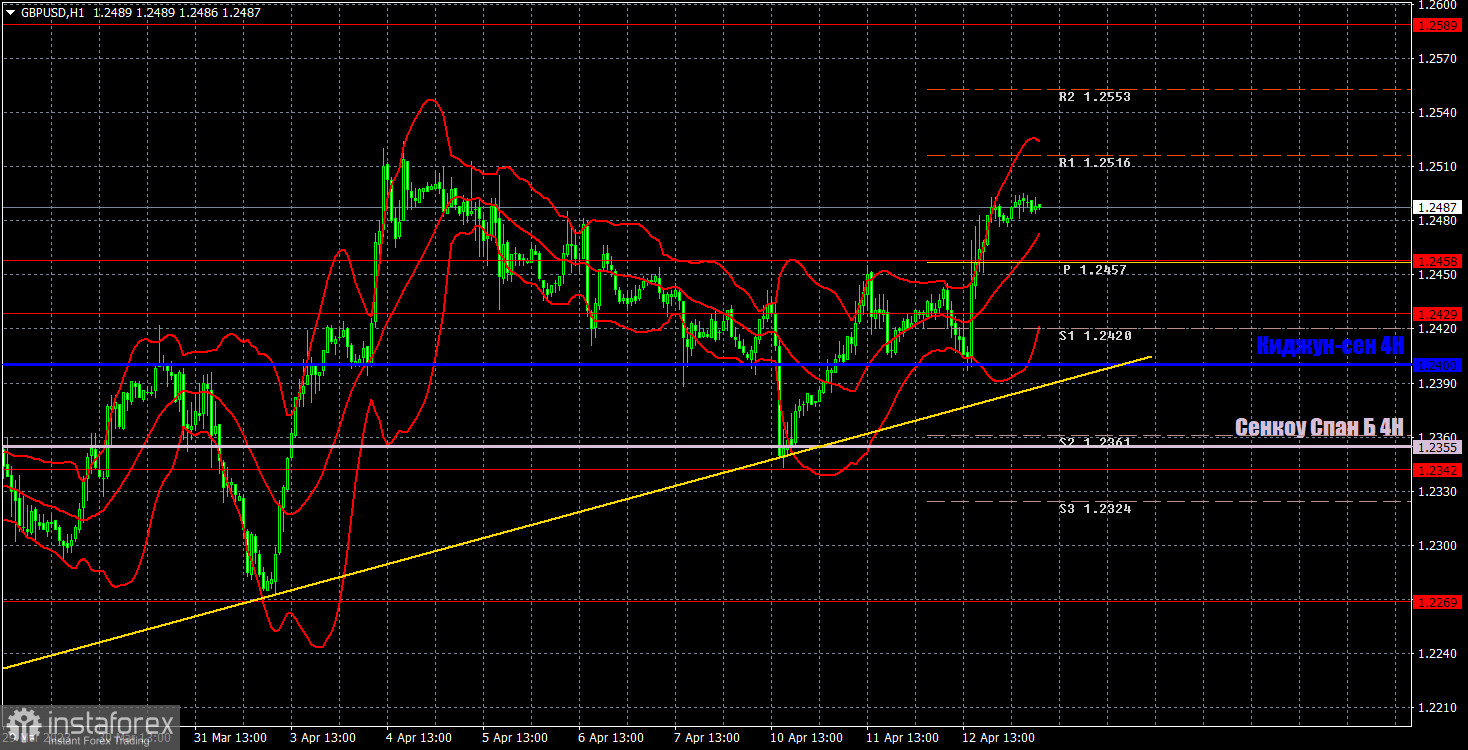
1H chart of GBP/USD
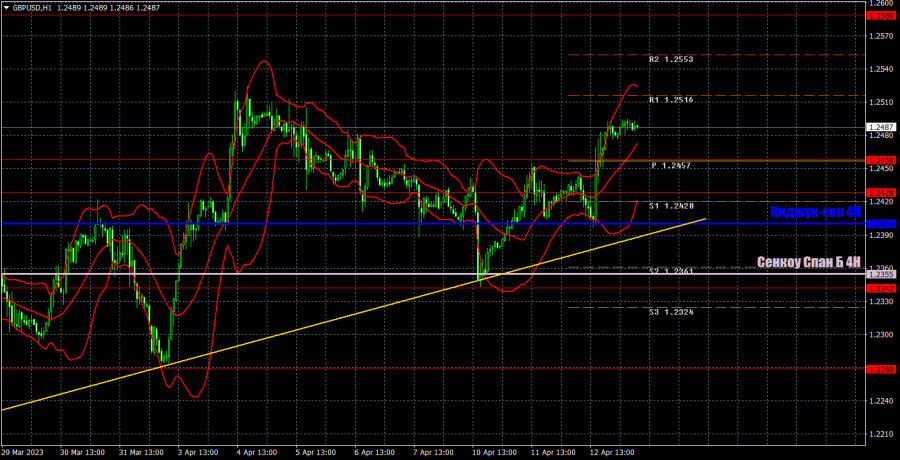
On the one-hour chart, GBP/USD maintains an uptrend, although in the last few days it has tried to enter a correction. The pound doesn't actually have good reasons for growth, but traders don't really care about this. Therefore, the pair may continue to move higher, even if there are no reasons for it. The price is still located above the trend line and above the Senkou Span B line, so for now, from a technical perspective, there are more chances for the pair to rise. For April 13th, we highlight the following important levels: 1.1927, 1.1965, 1.2143, 1.2185, 1.2269, 1.2342, 1.2429-1.2458, 1.2589, 1.2659, 1.2762. Senkou Span B (1.2355) and Kijun-sen (1.2400) lines can also generate signals. Rebounds and breakouts from these lines can also serve as trading signals. It is better to set the Stop Loss at breakeven as soon as the price moves by 20 pips in the right direction. The lines of the Ichimoku indicator can change their position throughout the day which is worth keeping in mind when looking for trading signals. On the chart, you can also see support and resistance levels where you can take profit. On Thursday, the UK has scheduled reports on GDP and industrial production. Both have a medium degree of significance, even closer to low. In the US, there are also secondary data: the Producer Price Index and initial jobless claims.
Indicators on charts:
Resistance/support - thick red lines, near which the trend may stop. They do not make trading signals.
Kijun-sen and Senkou Span B are the Ichimoku indicator lines moved to the hourly timeframe from the 4-hour timeframe. They are also strong lines.
Extreme levels are thin red lines, from which the price used to bounce earlier. They can produce trading signals.
Yellow lines are trend lines, trend channels, and any other technical patterns.
Indicator 1 on the COT chart is the size of the net position of each trader category.
Indicator 2 on the COT chart is the size of the net position for the Non-commercial group of traders.