empty
06.02.2023 11:49 AM
EUR/USD and GBP/USD technical analysis on February 6, 2023

EUR/USD

This image is no longer relevant

Higher time frames

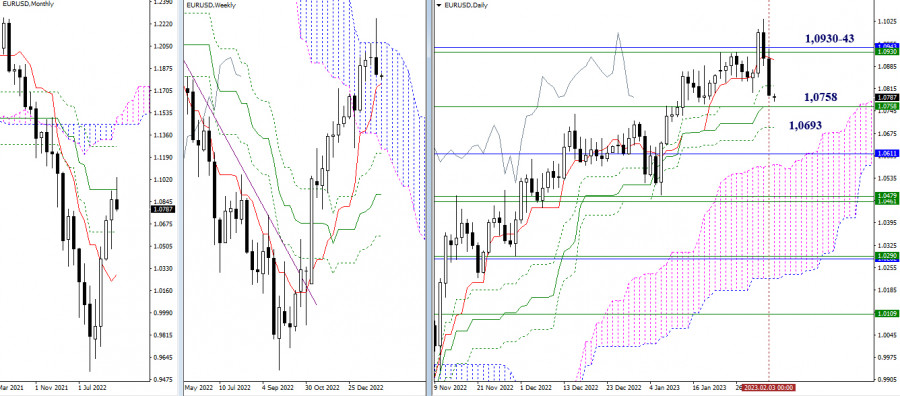
Last week, the pair bounced off the resistance area at 1.0930-43 which coincided with the upper boundary of the weekly Ichimoku Cloud and the monthly medium-term trend. To confirm a rebound and extend it further to the downside, bears need to overcome the support of the weekly short-term trend at 1.0758 and cancel the Golden Cross at 1.0758 – 1.0693.

This image is no longer relevant

H4 – H1

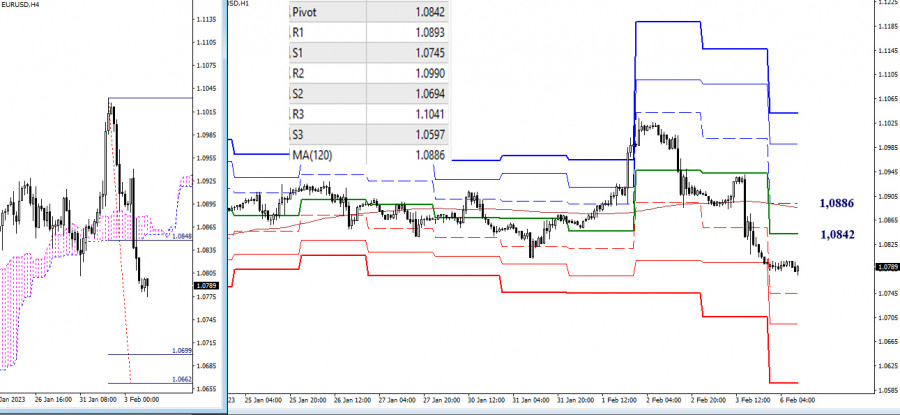
At the moment, bears have seized the initiative on lower time frames. Their downward targets for today are found at the standard pivot levels of 1.0745 – 1.0694 – 1.0597. Another target is the breakout point of the H4 Ichimoku Cloud at 1.0699 – 1.0692. Notably, the support zones on lower time frames are fortified by the support area on longer time periods at 1.0758 – 1.0693. The resistance is now formed by the key levels of the standard pivot point at 1.0842 and the weekly long-term trend at 1.0886. A firm hold above this price range may change the market balance.

***

GBP/USD

This image is no longer relevant

Higher time frames

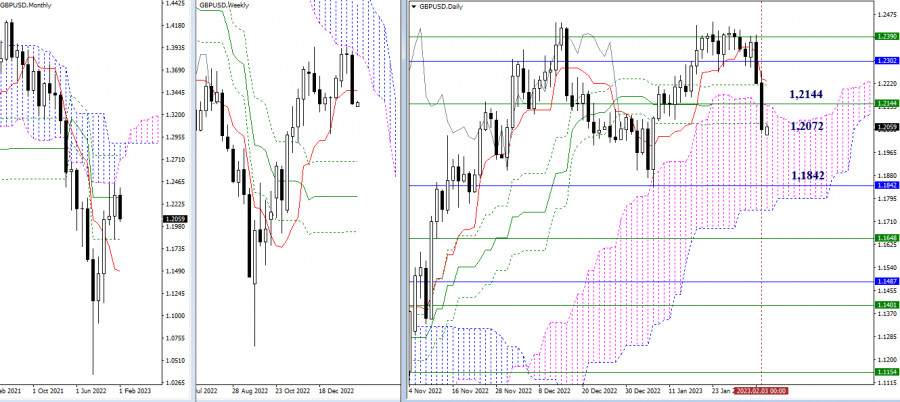
After trading for some time along the resistance level and the lower boundary of the weekly Ichimoku Cloud at 1.2390, the pair came under the control of the sellers. As a result, it closed last week below the key support levels of 1.2144 (weekly short-term trend) and 1.2072 (lower level of the daily Golden Cross). So, bears have entered the daily cloud and are confidently holding there. The levels left behind will now serve as new resistance that will protect the bearish trend. The next downward target is currently seen at the lower boundary of the daily Ichimoku Cloud and the monthly level of 1.1842.

This image is no longer relevant

H4 – H1

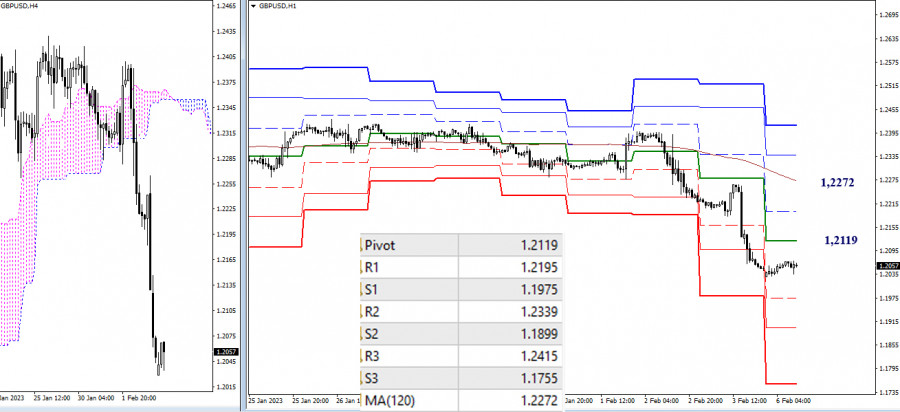
On lower time frames, bears are in control of the market. In the last few hours, the pair has been going through a correction. To deepen its current decline, the pair will need to pass the intraday support formed by the standard pivot levels of 1.1975 – 1.1899 – 1.1755. The key levels of the day are located at 1.2119 (daily central pivot level) and 1.2272 (weekly long-term trend). Consolidation above this range will change the market balance.

***

Technical analysis is based on:

Higher time frames – Ichimoku Kinko Hyo (9.26.52) + Fibo Kijun levels

Lower time frames – H1: Pivot Points (standard) + 120-day Moving Average (weekly long-term trend)

Evangelos Poulakis,
الخبير التحليلي لدى شركة إنستافوركس
© 2007-2025
حدد الإطار الزمني
5
د
15
د
30
د
1
س
4
ساعات
1
يوم
1
أسبوع
كسب عائد من تغيرات أسعار العملات المشفرة مع إنستافوركس.
قم بتحميل منصة التداول ميتاتريدر 4 وافتح أول صفقة.
  • Grand Choice
    Contest by
    InstaForex
    InstaForex always strives to help you
    fulfill your biggest dreams.
    انضم إلى المسابقة

المقالات الموصى بها

التحليل الفني لحركة السعر اللحظية لمؤشر ناسداك 100، الخميس 22 مايو 2025.

مع ظهور تباين بين حركة سعر مؤشر Nasdaq 100 الذي شكل قمة مزدوجة مع مؤشر Stochastic Oscillator بالإضافة إلى التأكيد مع حركة سعره التي تحركت تحت WMA (21) الذي لديه

Arief Makmur 07:01 2025-05-22 UTC+2

التحليل الفني لحركة السعر اللحظية لأزواج العملات الرئيسية USD/CHF، الخميس 22 مايو 2025

كما نرى في الرسم البياني لمدة 4 ساعات لزوج العملات الرئيسي USD/CHF، تظهر بعض المعلومات المثيرة للاهتمام، وهي أولاً ظهور تباين بين حركة سعر USD/CHF مع مؤشر Stochastic Oscillator، وثانياً

Arief Makmur 07:01 2025-05-22 UTC+2

توقعات EUR/USD ليوم 22 مايو 2025

يوم الأربعاء، نجح اليورو في التماسك فوق مستوى 1.1266 وخط مؤشر التوازن. المستويات المستهدفة التالية هي 1.1420 و1.1535. مؤشر مارلين على وشك الدخول إلى منطقة زخم الاتجاه الصاعد. اليوم،

Laurie Bailey 05:06 2025-05-22 UTC+2

توقعات GBP/USD ليوم 22 مايو 2025

فاجأت بيانات التضخم لشهر أبريل في المملكة المتحدة المشاركين في السوق يوم أمس. حيث ارتفع مؤشر أسعار المستهلكين الأساسي من 3.4% على أساس سنوي إلى 3.8% على أساس سنوي مقابل

Laurie Bailey 05:06 2025-05-22 UTC+2

توقعات USD/JPY ليوم 22 مايو 2025

زوج USD/JPY يتراجع لثمانية أيام متتالية — وهو نمط لم يُشاهد منذ عام 2019. ومع ذلك، شهدنا مؤخرًا تراجعين لمدة خمسة أسابيع في يوليو 2024 ونوفمبر–ديسمبر 2023، مما يشير

Laurie Bailey 05:06 2025-05-22 UTC+2

XAG/USD. التحليل والتوقعات

يتجه سعر الفضة نحو مستوى 33.25 دولار، متماسكًا بالقرب من الحد العلوي لنطاقه المألوف. يدعم ظهور عمليات الشراء عند التراجعات، والارتداد الأخير من المتوسط المتحرك البسيط لـ 100 يوم (SMA)

Irina Yanina 18:43 2025-05-21 UTC+2

إشارات التداول لليورو/الدولار الأمريكي للفترة من 21 إلى 25 مايو 2025: بيع تحت 1.1370 (200 EMA - تشبع شرائي)

في وقت مبكر من الجلسة الأمريكية، يتداول زوج اليورو/الدولار الأمريكي حول مستوى 1.1327، مما يظهر ضعفًا في القوة الصعودية. بعد أن وصل إلى قمة قناة الاتجاه الصاعد، يمر زوج اليورو/الدولار

Dimitrios Zappas 17:50 2025-05-21 UTC+2

إشارات التداول للذهب (XAU/USD) للفترة من 21 إلى 25 مايو 2025: الشراء فوق $3,281 (200 EMA - 6/8 Murray)

في وقت مبكر من الجلسة الأمريكية، يتم تداول الذهب حول 3,304، فوق مستوى 6/8 موراي، وداخل قناة الاتجاه الصاعد التي تشكلت في 14 مايو. من المتوقع أن يستمر الذهب

Dimitrios Zappas 17:47 2025-05-21 UTC+2

التوقعات لليورو/الدولار الأمريكي في 21 مايو 2025

يوم الثلاثاء، تمكن زوج اليورو/الدولار الأمريكي من التماسك فوق منطقة المقاومة 1.1260–1.1282، والتي كانت قد تسببت سابقًا في ثلاث تراجعات. ونتيجة لذلك، استمر الاتجاه الصعودي لليورو، وفي طريقه للأعلى، تمكن

Samir Klishi 11:19 2025-05-21 UTC+2

التوقعات لزوج الجنيه الإسترليني/الدولار الأمريكي في 21 مايو 2025

في الرسم البياني الساعي، قام زوج الجنيه الإسترليني/الدولار الأمريكي يوم الثلاثاء بارتدادين من منطقة الدعم 1.3344–1.3357، وانعكس لصالح الجنيه وارتفع فوق مستوى 1.3425. ونتيجة لذلك، قد يستمر الاتجاه الصعودي اليوم

Samir Klishi 11:15 2025-05-21 UTC+2
لا تستطيع التحدث الآن؟
اطرح سؤالك في الدردشة.
Widget callback
 

Dear visitor,

Your IP address shows that you are currently located in the USA. If you are a resident of the United States, you are prohibited from using the services of InstaFintech Group including online trading, online transfers, deposit/withdrawal of funds, etc.

If you think you are seeing this message by mistake and your location is not the US, kindly proceed to the website. Otherwise, you must leave the website in order to comply with government restrictions.

Why does your IP address show your location as the USA?

  • - you are using a VPN provided by a hosting company based in the United States;
  • - your IP does not have proper WHOIS records;
  • - an error occurred in the WHOIS geolocation database.

Please confirm whether you are a US resident or not by clicking the relevant button below. If you choose the wrong option, being a US resident, you will not be able to open an account with InstaForex anyway.

We are sorry for any inconvenience caused by this message.