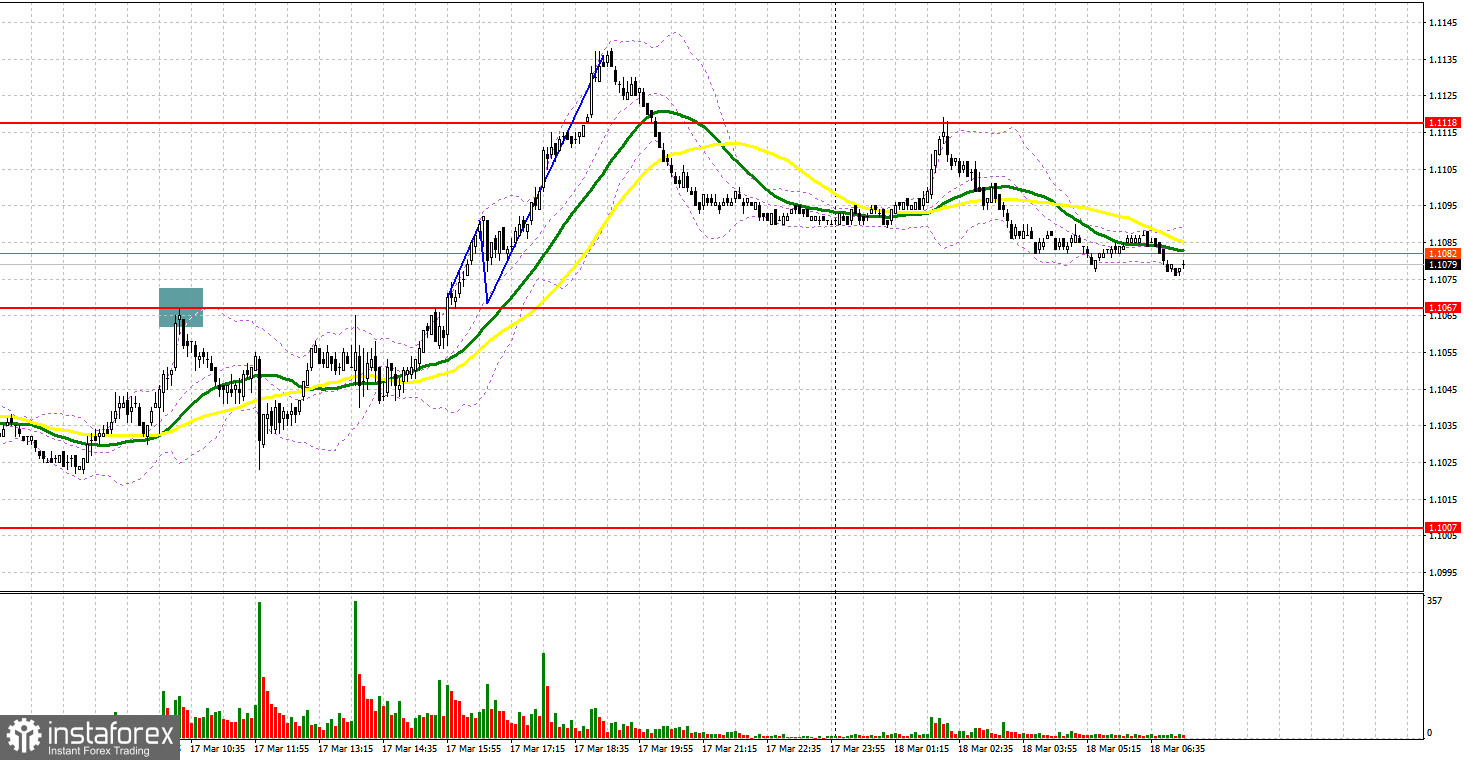
Conditions to open long positions on EUR/USD:
Yesterday, in the first part of the day, traders received only a signal to enter the market. Let us take a look at the 5-minute chart to analyze the market situation. Earlier, I attracted your attention to the level of 1.1067 so that you can decide when to enter the market. In the first half of the day, buyers of the euro boosted the price to 1.1067, but failed to push it higher.The bullish momentum faded away after the FOMC meeting. A false break of 1.1067 led to a buy signal. However, we did not notice any massive sell-off. Pressure on the euro/dollar pair became smaller after it lost 40 pips. During the US trade, the pair climbed above 1.1067. However, traders did not receive a signal to open long positions to downwardly test the level. Thus, the euro failed to approach the resistance level of 1.1118.
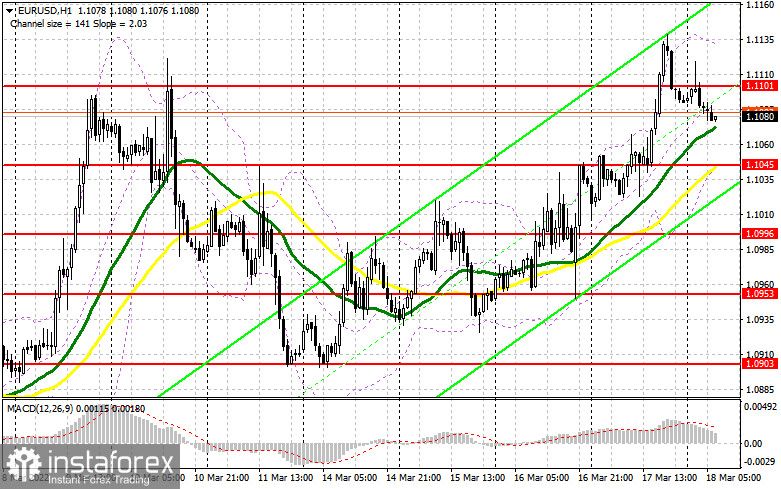
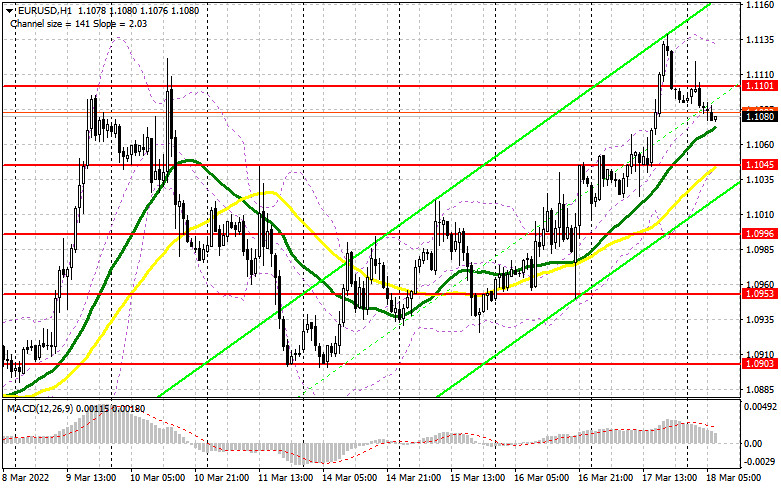
Today, the euro should renew yesterday's high. Otherwise, it will lose its upward momentum. This, in turn, may force traders to lock-in profits, thus causing a deeper decline in the euro/dollar pair. To reach new weekly highs, the pair should consolidate above 1.1101. However, bulls are likely to become active only when the price declines to the support level of 1.1045. Under the current conditions, including the absence of macroeconomic data from the eurozone, the euro will hardly go on rising. In addition, yesterday, the Kremlin denied information that Russia and Ukraine are on the path of resolving the conflict. Only a false break of 1.1045 will give the first signal to open long positions. However, to show a significant rise, the euro/dollar pair should exceed the resistance level of 1.1101. Notably, in the first part of the day, buyers are likely to make an attempt to boost the price above 1.1101. A downward test of the level will give a buy signal and allow the pair to recover to 1.1165, a strong resistance level, which may cause a bullish market. The farther target is located at 1.1227, where it is recommended to lock-in profits. If the price breaks this level, the bearish trend will end, allowing the pair to climb to such highs as 1.1271 and 1.1310. The scenario will become possible only amid news about the improvement of the geopolitical situation. It is better to avoid long positions if the pair drops and bulls fail to protect 1.1045. It will be wise to open long positions after a false break of 1.0996. It is also possible to open buy positions from 1.0953, expecting a rebound of 30-35 pips within a day.
Conditions to open short orders on EUR/USD:
Yesterday, in the first part of the day, bears were controlling the market. However, during the US trade, the situation changed. The euro jumped to pattern 11, where it lost momentum. Today, sellers should protect the level of 1.1101. A false break of the level will give a sell signal with the target at the support level of 1.1045. Since today, the macroeconomic calendar is empty, the pair will be able to break the mentioned level only in case of the market reversal. This action will force speculators to close their long positions. The upward test of 1.1045 will provide an additional short signal with the target at 1.0996 and 1.0953. A farther target is located at a new low of 1.0903. If the euro continues gaining in value and bears fail to protect 1.1101, bulls will continue opening long positions, expecting a further rise. In this case, it is better to avoid sell orders. It will be better to go short amid a false break of 1.1165. It is also possible to sell the euro from 1.1227 or 1.1271, expecting a decline of 15-20 pips.
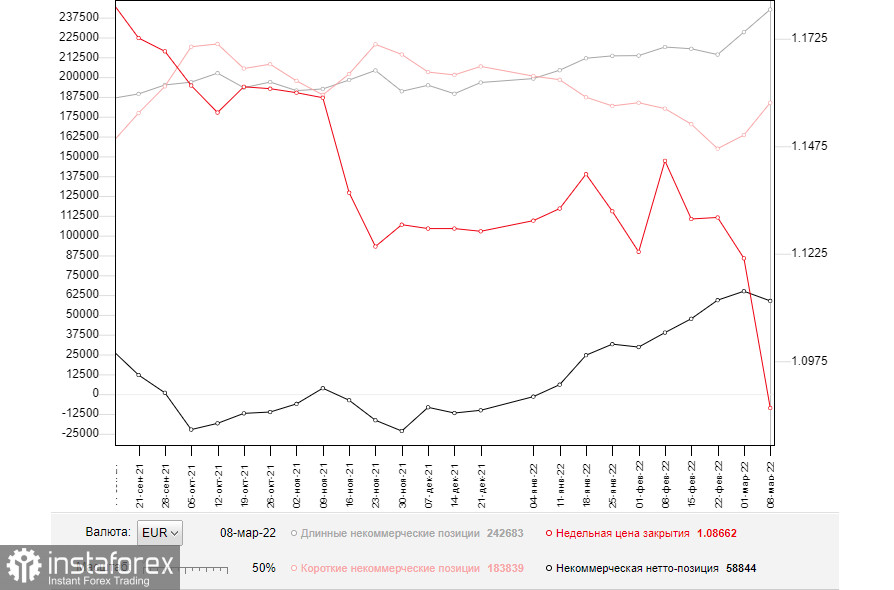
Commitment of Traders Report
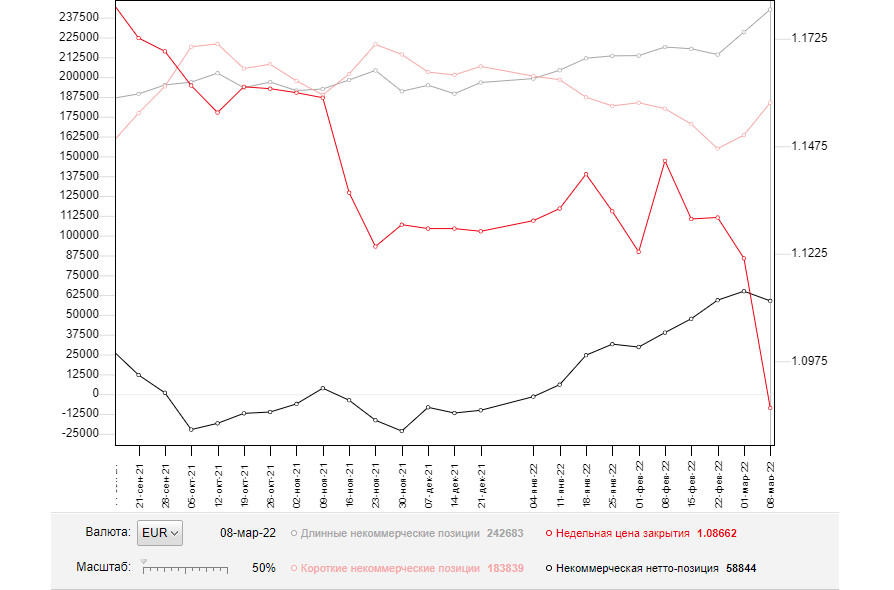
The COT report unveiled a rise in the number of both long and short positions. There is no wonder that the number of sellers advanced amid the special military operation in Ukraine. However, regardless of the euro's depreciation, buyers remain active amid the attractive price. Last week, the ECB held a meeting, thus bringing their policy to light. This fact added confidence to buyers of risk assets. Christine Lagarde unveiled the regulator's intention to switch to a more aggressive approach to QE tapering and the key interest rate hike. This announcement provided traders with a mid-term bullish signal. However, traders should also take into account the Fed meeting. It is difficult to predict the regulator's actions given the highest inflation rate in the last 40 years. In addition, the negotiations between Russia and Ukraine have not borne fruits yet. That is why I recommend continuing to buy the greenback since the main trend of the euro/dollar pair is still bearish. According to the COT report, the number of long non-commercial positions increased to 242,683 from 228,385, whereas the number of short non-commercial positions surged to 183,839 from 163,446. The weekly close price declined to 1.0866 from 1.1214.
Signals of indicators:
Moving Averages
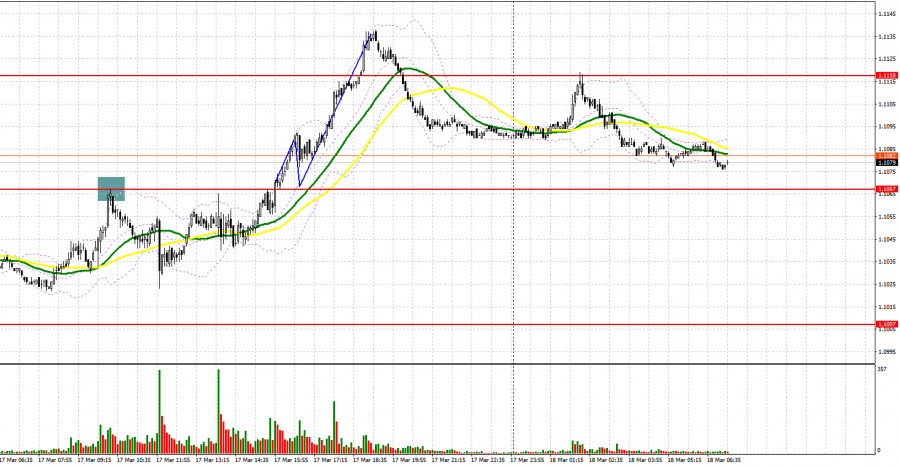
Trading is conducted just below the 30- and 50-day moving averages, which indicates that bears are still controlling the market. .
Note: The period and prices of moving averages are considered by the author on the one-hour chart that differs from the general definition of the classic daily moving averages on the daily chart.
Bollinger Bands
If the price rises, the upper limit of the indicator located at 1.1130 will act as a resistance level. In case of a decline, the lower limit of 1.1030 will act as a support level.
Description of indicators
- Moving average (moving average, determines the current trend by smoothing volatility and noise). The period is 50. It is marked in yellow on the chart.
- Moving average (moving average, determines the current trend by smoothing volatility and noise). The period is 30. It is marked in green on the graph.
- MACD indicator (Moving Average Convergence/Divergence - convergence/divergence of moving averages). A fast EMA period is 12. A slow EMA period is 26. The SMA period is 9.
- Bollinger Bands. The period is 20.
- Non-profit speculative traders are individual traders, hedge funds, and large institutions that use the futures market for speculative purposes and meet certain requirements.
- Long non-commercial positions is a total long position opened by non-commercial traders.
- Short non-commercial positions is a total short position opened by non-commercial traders.
- The total non-commercial net position is a difference between the short and long positions opened by non-commercial traders.