What is needed to open long positions on GBP/USD
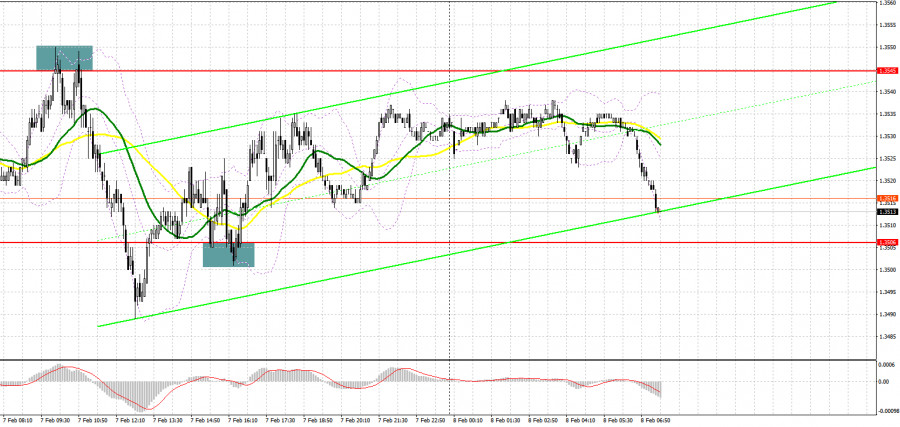
On Monday, there were many good signals to enter the market. Let's take a look at the 5-minute chart and see what happened there. In my morning review, I outlined the resistance level of 1.3545 and recommended taking decisions with this level in focus. Several unsuccessful attempts of bulls to push the price above 1.3545 led to the formation of excellent entry points into short positions. As a result, the pair declined by more than 60 pips, triggering a breakout of the support level of 1.3506. In the second half of the day, bulls succeeded and the price rose above the resistance level. An upward test of this level gave a buy signal. The pair grew by more than 30 pips. It was trading within the sideways channel.

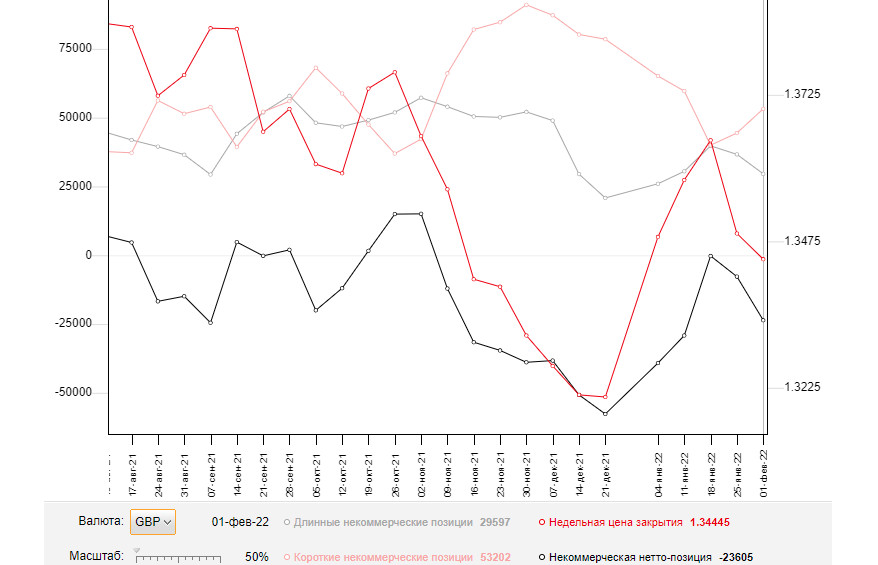
Before analyzing the technical indicators of the pound sterling, let's look at what happened in the futures market. The COT reports (Commitment of Traders) for February 1 showed a sharp increase in short positions and a drop in long ones. It made the market bearish again. However, this report does not take into account the results of the Bank of England meeting. The regulator decided to raise the interest rate. A tougher stance on monetary policy did not help the pound sterling. Traders are well aware that the central bank is trying to curb soaring inflation. So, such changes in monetary policy are aimed at reviving the economy. Given that the UK economy is currently going through hard times and at any moment the pace of economic growth may slow down significantly, the pound sterling was unable to resume a steady rally amid the key rate hike. Besides, market participants are expecting the Fed to raise the benchmark rate in March this year, which will be bearish for GBP/USD. Some speculators believe that the central bank may resort to a more aggressive stance and raise the interest rate by 0.5% at once, rather than by 0.25%. If so, the US dollar may assert strength. The COT report for February 1 revealed that the number of long non-commercial positions decreased to 29,597 from 36,666, while the number of short non-commercial positions rose to 53,202 from 44,429. This led to an even greater increase in the number of non-commercial net positions to -23,605 from -7,763. The weekly closing price dropped to 1.3444 from 1.3488.
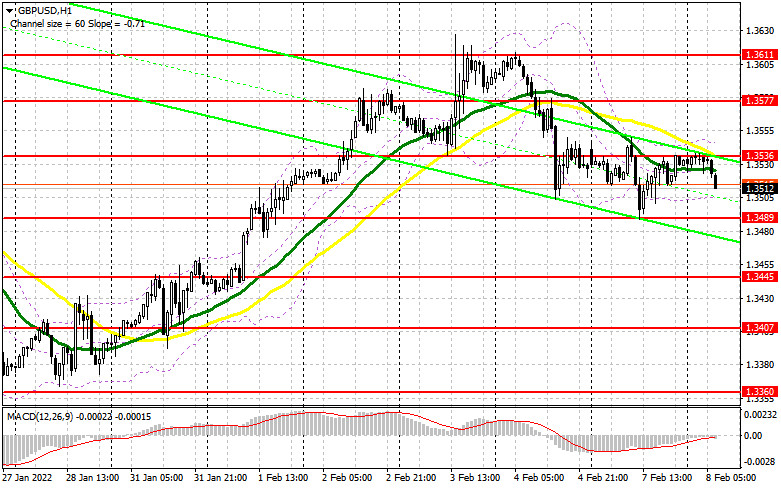
Like yesterday, the economic calendar for today is uneventful. This is why pressure on the British currency will weaken a little. The bulls managed to defend the 35th level yesterday. It remains to be seen whether they will be able to send the pair above 1.3536 today. Of course, the primary task of buyers is to protect the important support level of 1.3489, which was formed yesterday. If the pair declines, only the formation of a false breakout at 1.3489 will give a buy signal for GBP/USD despite the downward correction. It started after the Bank of England increased the interest rate. If such a scenario comes true, bulls will try to push the pair above the resistance level of 1.3536. This is a rather strong level. So, they need to accumulate strength. There are also moving averages that are located in the negative zone. The breakout and an upward test of this level will form an additional entry point and give bulls strength to send the price to the highs of 1.3577 and 1.3611. A more distant target level will be 1.3656 where I recommend locking in profits. In case of a decline of the pound sterling during the European session and a lack of activity at 1.3489, bulls may lose momentum. Therefore, it is best to postpone long positions until the pair hits the level of 1.3445. If so, an upward correction is likely to take place. Only the formation of a false breakout will give an entry point into long positions. I would advise you to buy GBP/USD immediately on a rebound from 1.3407 or even from a lower low of 1.3360. Bear in mind a 20-25 pip intraday correction.

What is needed to open short positions on GBP/USD
Bears are still in control. However, at any moment bulls may regain ground. Their main goal remains to protect 1.3536. A breakout of this range will undermine bullish momentum. The lack of fundamental statistics today will help bulls. So, I recommend sellers to be very careful. The formation of a false breakout at the level of 1.3536 will give an entry point into short positions. The downward correction may push the pair to 1.3489. Bulls and bears will have to fight hard for this level as trading volumes were high there yesterday. A breakout and a downward test of 1.3489 will trigger a drop in stop-loss orders. As a result, the GBP/USD pair may tumble to a low of 1.3445. Only the consolidation and test of this range will give a new entry point into short positions with the prospect of a decline to 1.3407 and 1.3360. I recommend locking in profits at this level. If the pair rises during the European session and sellers do not show activity at 1.3536, it is best to postpone sales until the price approaches the resistance level of 1.3577. I also advise you to open short positions at this level only in case of a false breakout. You can sell GBP/USD immediately on a rebound from last week's high of 1.3611 or even higher high of 1.3656. Please, do not forget about a 20-25 pip intraday correction.

Signals of technical indicators
Moving averages
GBP/USD is trading below 30- and 50-period moving averages, signaling a downward correction.
Remark. The author is analyzing the period and prices of moving averages on the 1-hour chart. So, it differs from the common definition of classic daily moving averages on the daily chart.
Bollinger Bands
A breakout of the lower limit at about 1.3500 will exert pressure on the pair. Alternatively, a breakout of the upper limit at about 1.3545 will help the pair move up.
Definitions of technical indicators
- Moving average recognizes an ongoing trend through leveling out volatility and market noise. A 50-period moving average is plotted yellow on the chart.
- Moving average identifies an ongoing trend through leveling out volatility and market noise. A 30-period moving average is displayed as the green line.
- MACD indicator represents a relationship between two moving averages that is a ratio of Moving Average Convergence/Divergence. The MACD is calculated by subtracting the 26-period Exponential Moving Average (EMA) from the 12-period EMA. A 9-day EMA of the MACD called the "signal line".
- Bollinger Bands is a momentum indicator. The upper and lower bands are typically 2 standard deviations +/- from a 20-day simple moving average.
- Non-commercial traders - speculators such as retail traders, hedge funds, and large institutions who use the futures market for speculative purposes and meet certain requirements.
- Non-commercial long positions represent the total long open position of non-commercial traders.
- Non-commercial short positions represent the total short open position of non-commercial traders.
- The overall non-commercial net position balance is the difference between short and long positions of non-commercial traders.


