To open long positions on EUR/USD, you need:
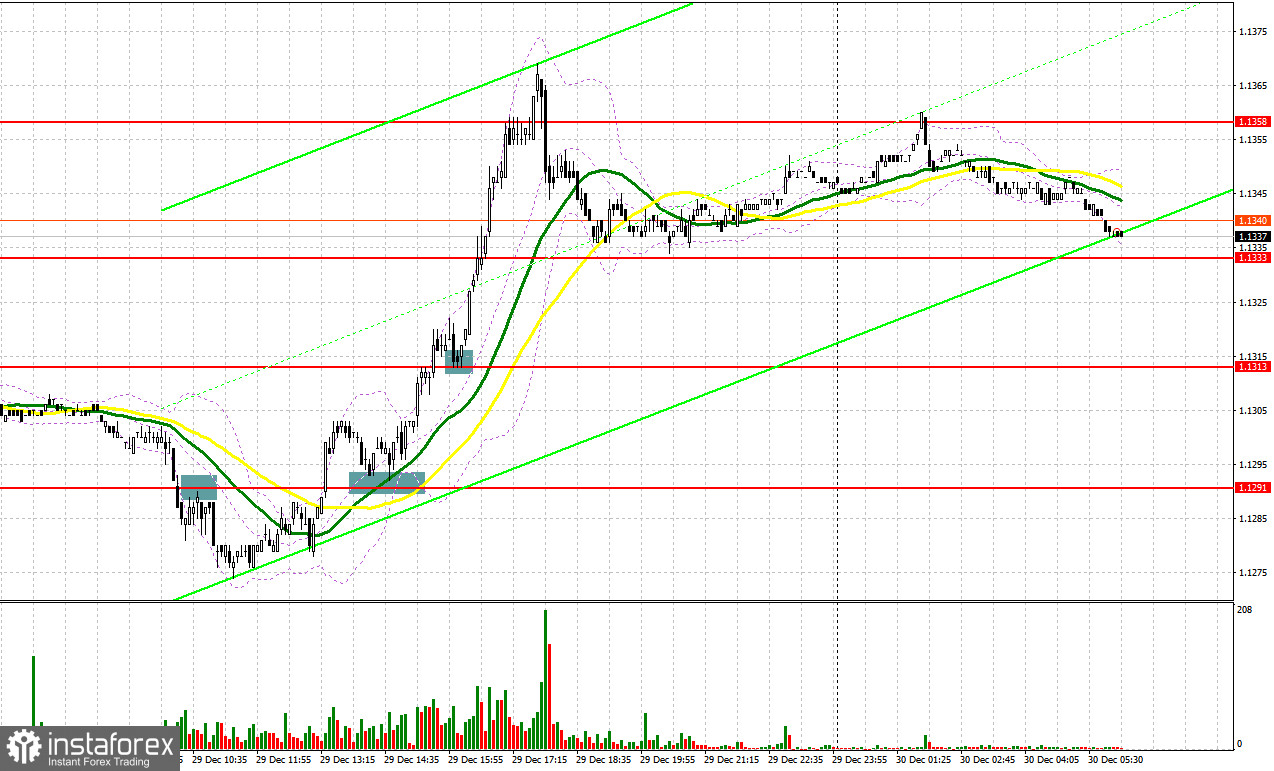
Quite a large number of profitable signals were formed yesterday. Let's take a look at the 5 minute chart and understand the entry points. In my morning forecast, I paid attention to the 1.1291 level and advised you to make decisions based on it. In the morning, the bears tried to break below 1.1291 and even achieved a reverse test from below upward of this level, which led to forming a sell signal. There was no sharp decline, and after moving down 15 points, the demand for the euro returned. Return and reverse test from top to bottom 1.1291 formed an excellent entry point into long positions, after which one could observe growth and a similar consolidation above 1.1313. This led to another buy signal. As a result, the euro rose by more than 70 points.
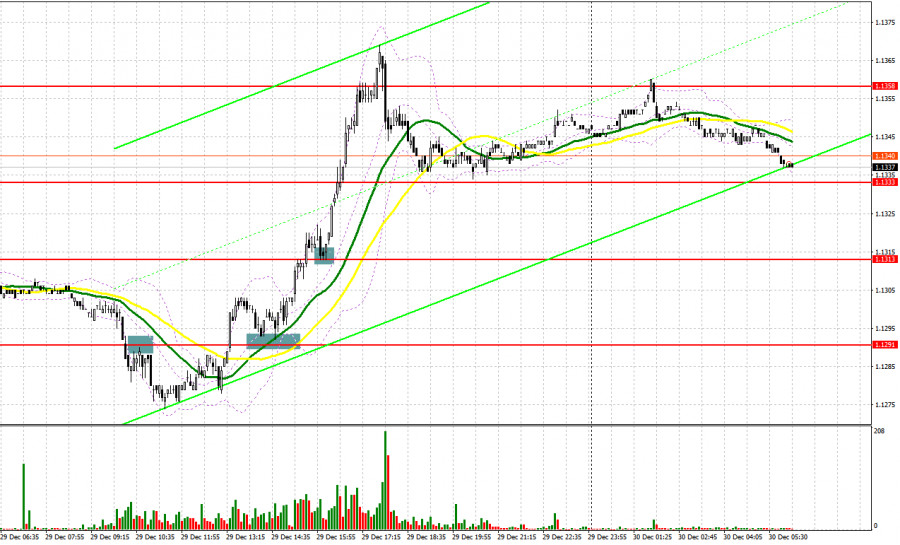
Despite the large rally in the euro, the trading volume is very low, so do not be surprised if you see the same uncontrolled fall in EUR/USD this morning as it did with yesterday's rally. The absence of important fundamental statistics for the eurozone should affect the market volatility. Larger movements are expected only during the US session, when a number of reports on the US economy are released. Forming a false breakout at the level of 1.1333 during the European session will be a signal to buy the euro while expecting a repeated recovery to the resistance of 1.1358, above which it has not yet been possible to get out. Apparently there are big bears there. Surpassing this range is important, and a reverse test from top to bottom will open the opportunity for growth to the area of new levels: 1.1381 and 1.1415, where I recommend taking profits. The 1.1442 level will be a distant target. If the pair declines during the European session and the bulls are not active at 1.1333, it is best to postpone long positions until the larger support at 1.1313, slightly above which are the moving averages playing on the bulls' side. However, I advise you to open long positions there when a false breakout is formed. The bulls' last hope to keep the pair in the upward correction channel will be the 1.1292 low, from which you can open long positions immediately on a rebound, counting on an upward correction of 20-25 points within the day.
To open short positions on EUR/USD, you need:
The bears tried to turn the market over to their side yesterday, but received a powerful rebuff. As a result of the large rally, the bears are in serious trouble. If the pair rises again in today's European session, the bears should try to do everything possible to protect the resistance at 1.1358, since the pair should definitely not be released above this level. Considering that there are no important statistics today, it is quite possible that it will be possible to defend this range, which will keep trading within a wide horizontal channel. Low volume in the morning will contain volatility. Forming a false breakout at 1.1358 creates the first entry point to short positions in hopes of a return of pressure on EUR/USD and a decline to the 1.1333 area. A more active struggle will unfold for this level. A breakdown and test from the bottom up of this range will provide another signal to open short positions with the prospect of a decline to a large low like 1.1313. Only a breakthrough of this level will take down a number of bulls' stop orders and cause a larger fall in EUR/USD with renewed lows: 1.1292 and 1.1265, where I recommend taking profits. If the euro grows and the bears are not active at 1.1358, it is best not to rush to sell. The optimal scenario will be short positions when a false breakout is formed in the 1.1381 area. It is possible to sell EUR/USD immediately on a rebound from the high of 1.1415, or even higher - in the 1.1442 region, counting on a downward correction of 15-20 points.
I recommend for review:
The Commitment of Traders (COT) report for December 21 revealed that both short and long positions increased, but the latter declined slightly more, which led to a reduction in the negative delta value. This data takes into account the recent meetings of the Federal Reserve and the European Central Bank. However, judging by the alignment of forces, nothing has changed much, which is generally confirmed by the schedule. Many problems in the economies of the eurozone and the United States remain due to the Omicron strain of coronavirus, which does not allow representatives of central banks to live peacefully. Most likely, the further monetary policy of the Fed and the ECB will depend on how the situation with the coronavirus will develop after the New Year. The report shows that the buyers of risky assets, and we are talking about the euro, are in no hurry to build up long positions even after the recent statements by the ECB that it plans to fully complete its emergency bond buying program as early as next March. On the other hand, the US dollar also has support: the Fed is planning to raise interest rates as early as next spring, which makes the US dollar more attractive. The COT report indicated that long non-commercial positions rose from 189,530 to 196,595, while short non-commercial positions rose from 201,409 to 206,757. This suggests that traders will continue to actively fight for further direction. market. At the end of the week, the total non-commercial net position decreased its negative value from -11,879 to -10,162. The weekly closing price, due to the horizontal channel, remained almost unchanged - 1.1277 against 1.1283 a week earlier.
Indicator signals:
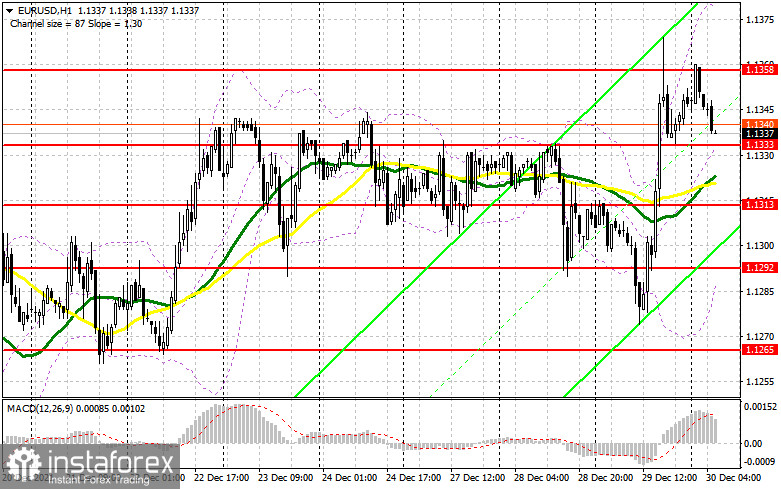
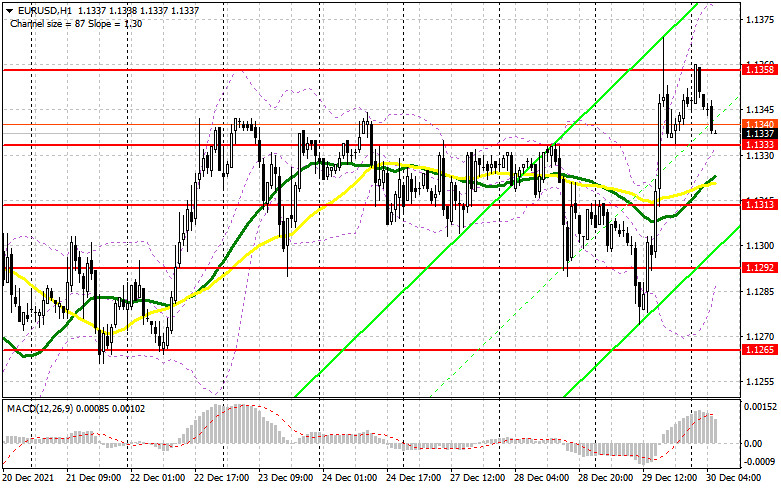
Trading is carried out above the 30 and 50 daily moving averages, which indicates an attempt by the bulls to continue the growth of the pair at the end of the year.
Moving averages
Note: The period and prices of moving averages are considered by the author on the H1 hourly chart and differs from the general definition of the classic daily moving averages on the daily D1 chart.
Bollinger Bands
In case of a decline, support will be provided by the lower border of the indicator at 1.1305. In case of growth, the upper border of the indicator in the area of 1.1365 will act as a resistance.
Description of indicators
- Moving average (moving average, determines the current trend by smoothing out volatility and noise). Period 50. It is marked in yellow on the chart.
- Moving average (moving average, determines the current trend by smoothing out volatility and noise). Period 30. It is marked in green on the chart.
- MACD indicator (Moving Average Convergence/Divergence — convergence/divergence of moving averages) Quick EMA period 12. Slow EMA period to 26. SMA period 9
- Bollinger Bands (Bollinger Bands). Period 20
- Non-commercial speculative traders, such as individual traders, hedge funds, and large institutions that use the futures market for speculative purposes and meet certain requirements.
- Long non-commercial positions represent the total long open position of non-commercial traders.
- Short non-commercial positions represent the total short open position of non-commercial traders.
- Total non-commercial net position is the difference between short and long positions of non-commercial traders.