To open long positions on EURUSD, you need:
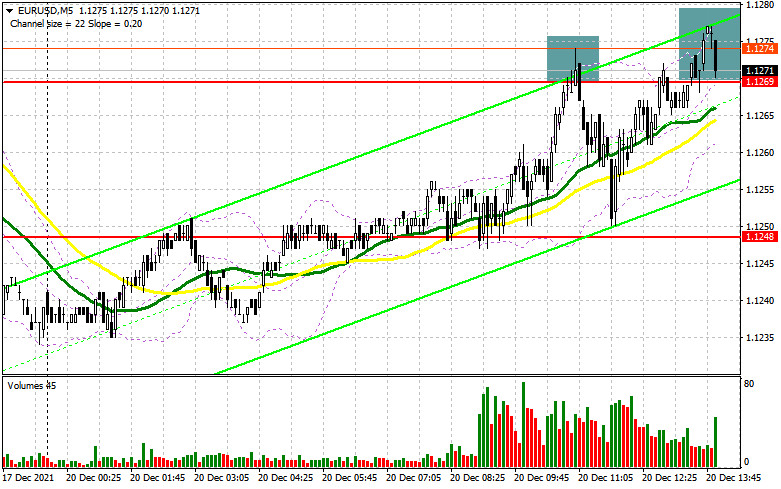
In my morning forecast, I paid attention to the 1.1269 level and advised making decisions on entering the market. Let's look at the 5-minute chart and figure out what happened. An unsuccessful attempt by the bulls to regain control of the resistance of 1.1269 led to the formation of a sell signal for the euro, after which the pair fell 20 points down. However, the bulls did not abandon the shadow of the upward correction and broke above 1.1269 on the second attempt. Now it is very important to protect this level since any return of the pair below 1.1269 will again lead to a major sell-off of the euro. And what were the entry points for the pound this morning?

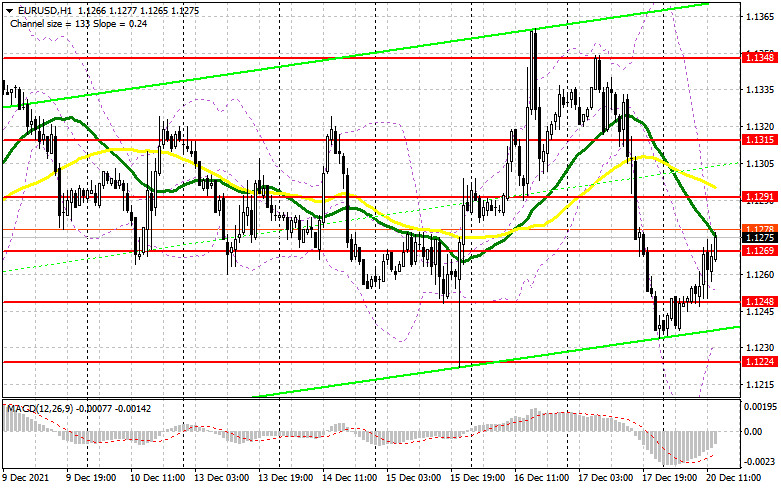
The release of important fundamental data is not scheduled for the American session, so the upward correction may continue. This requires protection level 1.1269. Its top-down test will lead to the formation of a signal to buy the euro with the prospect of further recovery of the pair in the area of 1.1291, where the moving averages are playing on the side of sellers and limiting the upward potential of the pair. An equally important task will be a breakthrough and consolidation above 1.1291. The test of this level from top to bottom forms an additional entry point into euro purchases with the prospect of updating the resistance at 1.1315. After that, we can talk about the return of the bullish potential of the European currency. If the pair declines during the American session and there is no bull activity at 1.1269, it is best to postpone purchases to larger support of 1.1248. I advise buying EUR/USD immediately for a rebound from the minimum of 1.1224, or even lower - around 1.1208 with the aim of an upward correction of 20-25 points within a day.
To open short positions on EURUSD, you need:
The main task of the bears for the second half of the day is to protect the 1.1269 level. Only the formation of a false breakdown there, by analogy with the one I analyzed a little above, forms an additional entry point into short positions to maintain pressure on the pair and decrease to the lower boundary of the side channel 1.1224. A breakdown and a bottom-up test of the intermediate support of 1.1248 will lead to another signal to open short positions with the prospect of a decline to the area of 1.1224. Only going beyond this level will demolish several buyers' stop orders and cause a larger drop in the pair with the resumption of the bearish trend in the area of 1.1208 and 1.1188. A more distant target will be the 1.1155 level, where I recommend fixing the profits. In the event of a rise in the euro and the absence of bear activity at 1.1269, and while trading will be conducted above this range, the advantage will be on the side of buyers, it is best not to rush with sales. The optimal scenario will be short positions when forming a false breakdown in the area of 1.1291 – there are moving averages playing on the sellers' side. It is possible to sell EUR/USD immediately on a rebound from the highs: 1.1315 and 1.1348 with the aim of a downward correction of 15-20 points.

The COT report (Commitment of Traders) for December 7 recorded a decrease in short positions and a slight increase in long ones, which led to a decrease in the negative value of the delta. Many traders were preparing for the meetings of central banks that will be held this week. Very serious changes are expected in the monetary policy of the Federal Reserve System, as well as the European Central Bank. The inflation data force the management to act more aggressively, but which way it will choose is a rather difficult question. Last week, there were several speeches by the Chairman of the Federal Reserve System Jerome Powell, who in his comments spoke enough about the expected changes in monetary policy towards its tightening. The omicron coronavirus strain also prevents Europeans and Americans from sleeping peacefully, which constrains demand for risky assets in the face of uncertainty about the future policy of the European Central Bank. The latest November COT report indicated that long non-profit positions rose from the level of 191,048 to the level of 194,869, while short non-profit positions fell from the level of 214,288 to the level of 203,168. This suggests that traders preferred to fix part of the profit before important events in the conditions of the formed side channel. At the end of the week, the total non-commercial net position decreased its negative value from -23,240 to -8,299. The weekly closing price, on the contrary, did not change due to the side channel - 1.1283 against 1.1292.
Signals of indicators:
Moving averages
Trading is conducted below 30 and 50 daily moving averages, which indicates the preservation of the downward potential of the pair.
Note: The period and prices of moving averages are considered by the author on the hourly chart H1 and differ from the general definition of the classic daily moving averages on the daily chart D1.
Bollinger Bands
A break of the upper limit in the area of 1.1269 will lead to a new wave of growth of the pair. In case of a decline in the pair, the lower limit of the indicator around 1.1230 will act as support.
Description of indicators
- Moving average (moving average determines the current trend by smoothing out volatility and noise). Period 50. The graph is marked in yellow.
- Moving average (moving average determines the current trend by smoothing out volatility and noise). Period 30. The graph is marked in green.
- MACD indicator (Moving Average Convergence / Divergence - moving average convergence/divergence) Fast EMA period 12. Slow EMA period 26. SMA period 9
- Bollinger Bands (Bollinger Bands). Period 20
- Non-profit speculative traders, such as individual traders, hedge funds, and large institutions that use the futures market for speculative purposes and meet certain requirements.
- Long non-commercial positions represent the total long open position of non-commercial traders.
- Short non-commercial positions represent the total short open position of non-commercial traders.
- Total non-commercial net position is the difference between the short and long positions of non-commercial traders.


